Download
1 / 16
180 likes | 429 Vues
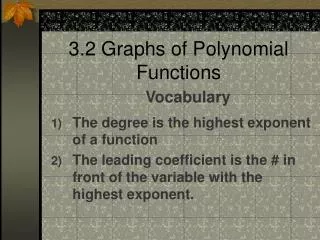
Chapter 3 – Polynomial and Rational Functions. Section 3.2 Polynomial Functions and Their Graphs. Definition. Example. Find the degree, leading coefficient, leading term, coefficients, and constant terms of the below polynomial function. Definition.

E N D
Chapter 3 – Polynomial and Rational Functions Section 3.2 Polynomial Functions and Their Graphs 3.2 - Polynomial Functions and Their Graphs
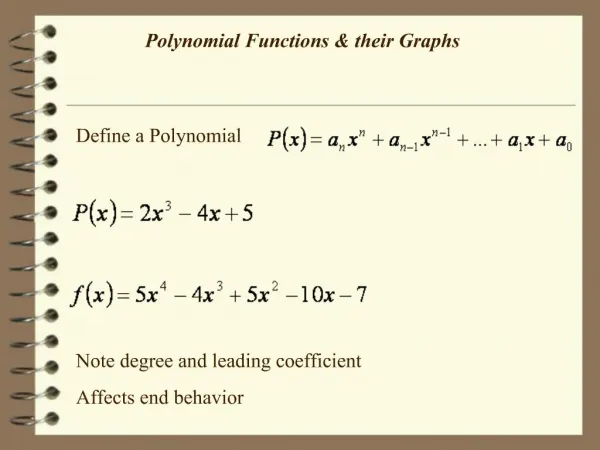
Definition 3.2 - Polynomial Functions and Their Graphs
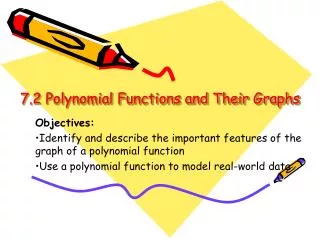
Example • Find the degree, leading coefficient, leading term, coefficients, and constant terms of the below polynomial function. 3.2 - Polynomial Functions and Their Graphs
Definition • The graph of a polynomial function is continuous meaning the graph has no breaks or holes. The graph is also smooth and has no corners or cusps (sharp points). 3.2 - Polynomial Functions and Their Graphs
Example • Determine which of the graphs below are continuous. 3.2 - Polynomial Functions and Their Graphs
Definition • The end behavior of a polynomial is a description of what happens as x becomes large in the positive or negative direction. We use the following notation: x→∞ means “x becomes large in the positive direction” x →-∞ means “x becomes large in the negitivedirection” 3.2 - Polynomial Functions and Their Graphs
End Behavior • The end behavior of a polynomial is determined by the degree n and the sign of the leading coefficient an. 3.2 - Polynomial Functions and Their Graphs
End Behavior • The end behavior of a polynomial is determined by the degree n and the sign of the leading coefficient an. 3.2 - Polynomial Functions and Their Graphs
Guidelines for Graphing 3.2 - Polynomial Functions and Their Graphs
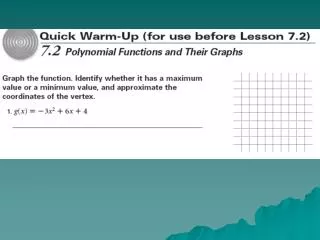
Example – pg. 244 #19 • Sketch the graph of the polynomial function. Make sure your graph shows all intercepts and exhibits proper end behavior. 3.2 - Polynomial Functions and Their Graphs
Definition • If c is a zero of a polynomial P, and the corresponding factor x – c occurs exactly m times in the factorization of P, then we say that c is a zero of multiplicity m. • Multiplicity helps determine the shape of a graph. 3.2 - Polynomial Functions and Their Graphs
Shape of a Graph near Zero 3.2 - Polynomial Functions and Their Graphs
Definitions • If the point (a, f (a)) is the highest point on the graph of f within some viewing rectangle, then f (a) is a local maximum. • If the point (a, f (a)) is the lowest point on the graph of f within some viewing rectangle, then f (a) is a local minimum. • The local minimum and maximum on a graph of a function are called its local extrema. 3.2 - Polynomial Functions and Their Graphs
Local Extrema 3.2 - Polynomial Functions and Their Graphs
Local Extrema of Polynomials • If P(x) = anxn + an-1xn-1 + … + a1x + a0 is a polynomial of degree n, then the graph of P has at most n – 1 local extrema. 3.2 - Polynomial Functions and Their Graphs
Example • Graph the polynomial below and identify all extrema, solutions, multiplicity, and end behavior. 3.2 - Polynomial Functions and Their Graphs