Download
1 / 9
90 likes | 222 Vues
GRAPH NOTES. PURPOSE OF A GRAPH. The purpose of a graph is to display the data as a picture Use the averages from the data table. GRAPH RUBRIC worth 4 points. 1 pt – Title 1 pt – Labels with Units IV on X-axis & DV on Y-axis 1 pt – Consistent Numbering / Naming

E N D
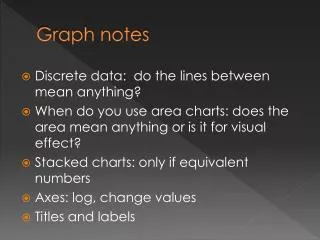
PURPOSE OF A GRAPH • The purpose of a graph is to display the data as a picture • Use the averages from the data table
GRAPH RUBRICworth 4 points • 1 pt – Title • 1 pt – Labels with Units IV on X-axis & DV on Y-axis • 1 pt – Consistent Numbering / Naming • 1 pt – Correct line / bars based on IV and Averages
GRAPH FORMAT The effect of “IV” on “DV” DV (units) IV (units)
2 TYPES OF GRAPHS • Bar Graph • Line Graph
BAR GRAPH • For when the IV is quaLitative • example
LINE GRAPH • For when the IV is quaNtitative • example
Skeleton graph • No data input. Just title and labels • The same for each type of graph • example
What type of graph do we use for a qualitative IV? • What type of graph do we use for a quantitative IV?