Download
1 / 98
990 likes | 1.23k Vues
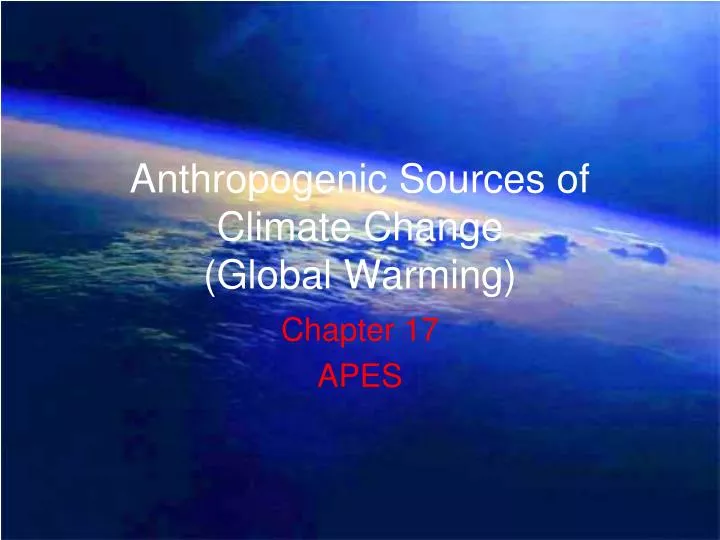
Anthropogenic Sources of Climate Change (Global Warming). Chapter 17 APES. Anthropogenic Sources of Climate Change. Two main causes 1. Deforestation 2. Increasing Greenhouse Gas levels Burning Fossil Fuels Main villain is currently CO2. Deforestation. Deforestation - US.

E N D
Anthropogenic Sources of Climate Change(Global Warming) Chapter 17 APES
Anthropogenic Sources of Climate Change • Two main causes 1. Deforestation 2. Increasing Greenhouse Gas levels • Burning Fossil Fuels • Main villain is currently CO2
Deforestation - US • About one half of the forests that covered the Earth are gone • Since 1600, 90% of the U.S. forests have been cleared away
Results of Deforestation • Loss of trees’ ability to remove CO2 • Decaying trees release CO2 and methane • 25% of global GHG emissions • Fallen trees are often burned which releases CO2 • Accounts for 20% of global CO2 emissions • Deforestation the largest source of emissions in developing countries
Greenhouse Effect • Certain gases in the Earth’s atmosphere trap energy from the sun • carbon dioxide – water vapor • methane – nitrous oxide • Without these gases, the Earth’s average temperature would be about 60ºF colder • These gases are Greenhouse Gases
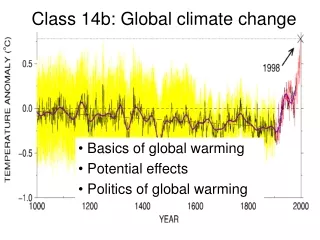
Evidence of Global Warming • CO2 and Temperature
Mauna Loa Study • Study air chemistry in remote location in Hawaii from 1950’s to present • Showed annual fluctuations in CO2 btwn winter & summer (why it looks like a zig-zag) • Also a steady CO2 increase from 315 ppm by volume in 1958 to 370 ppm in 1999. • This graph has been on almost every APES test!!!
Five Warmest Years on Record • 2005 • 1998 • 2002 • 2003 • 2004 Since 1980, the Earth has experienced 19 of its 20 hottest years on record
Evidence • CO2 and Temperature • Glaciers
Glaciers • Have been shrinking throughout the 20th Century • Loss of glaciers in South America and Asia is particularly rapid and will threaten the water supplies of millions of people • http://www.cnn.com/2007/TECH/science/11/26/andes.water.ap/index.html
Evidence • CO2 and Temperature • Glaciers • Polar Ice • Arctic • Antarctic • Greenland
Perennial ice may be 10 or more feet thick New ice is only one to seven feet thick Since 1970 10% loss of ice cover per decade Arctic Ice
NASA Sees Rapid Changes in Arctic Sea Ice NEWS RELEASE: September 13, 2006 • From 1970 until 2000 there was a 10 percent decrease in Arctic perennial sea ice every decade • Between 2004 and 2005 the ice shrunk abruptly by 14 percent
Permafrost • Where soil over 1-meter down never thaws • About 10% of Earth’s surface has permafrost • Tundra and taiga are characterized by extreme cold • 24 hours of sun during the summer • Huge amount of vegetation grows • In the last 11,000 years, the permafrost has not thawed • None of the vegetation has decayed • Decay releases CO2 and methane
Permafrost • Alaska permafrost temperature has increased 0.5° to 1.5° C since 1980, • Serious effects include • sinking roads and buildings • eroding tundra riverbanks • changes in tundra vegetation • increased carbon dioxide and methane emissions from thawed peat.
Permafrost • Estimates of billions of tons of methane • Will double existing methane in atmosphere • Methane is 20 to 60 times as strong of a greenhouse gas as CO2
Antartica • Land mass covered by multiple glaciers • Glaciers average 8000 feet thick • Represents 10% of all landmass on Earth
Moulins • Rivers of water about 10 meters in diameter that flow through the glacier • Bring melted water below the glaciers • Can cause glaciers to slip off bedrock into ocean
Antarctica Melting If all of the ice in the glaciers of Antarctica melt the oceans will rise 200 feet
Greenland Ice Melt • Glaciers located on three islands • Greenland loses 20% more ice than it gains each year • If all of the ice melts – oceans will rise 23 feet • If moulins work like those in Antarctica… • http://www.cnn.com/SPECIALS/2007/planet.in.peril/greenland.html
Evidence • CO2 and Temperature • Glaciers • Polar Ice • Arctic • Antarctic • Greenland • Weather Severity
Droughts • The 1999-2002 national drought was one of the three most extensive droughts in the last 40 years • In 2002, the Western United States experienced its second worst wildfire season in the last 50 years; more than 7 million acres burned • The period from April through June of 1998 was the driest three-month period in 104 years in Florida, Texas, and Louisiana
Evidence • CO2 and Temperature • Glaciers • Polar Ice • Arctic • Antarctic • Greenland • Weather Severity • Biome Changes
Oceans absorb CO2 • CO2 in water makes Carbonic Acid • Increased CO2 especially in cold water • As cold deep ocean currents (abyssal) resurface they release CO2 • Greater acidity of oceans is bleaching coral
Consequence • Cold Europe