Download
1 / 8
80 likes | 156 Vues
UNDERSTANDING AND INTERPRETATION OF OZONE CHANGES. A Presentation by Bismark Okaikwei. CONTENTS. Dynamical Processes Chemical Processes Inorganic bromine 3. Solar Cycle Variation 4. Summary. Dynamical Process.

E N D
UNDERSTANDING AND INTERPRETATION OF OZONE CHANGES A Presentation by Bismark Okaikwei
CONTENTS • Dynamical Processes • Chemical Processes • Inorganic bromine 3. Solar Cycle Variation 4. Summary
Dynamical Process • Interannual and long-term changes in strength of the stratospheric mean meridional (Brewer-Dobson) circulation, which is responsible for the winter spring buildup of extratropical ozone. • Changes in tropospheric circulation,particularly changes in the frequency of local nonlinear synoptic wave foercing events, which lead to the formation of extreme ozone minima (“mini hole") and associated large increases in tropopause height.
Dynamical Processes Figure 1 Interannual ozone variability and trend from 1979-2002 period. (a) Comparison of observed and empirically estimated observed ozone at 45ºN for February when both 350 KPV and EP flux, averaged over the 40N to 70N latitude band and integrated over January and February are considered as predictor variables in the empirical model. • As in (a) but for March. In this case, EP flux is integrated over January to March period.
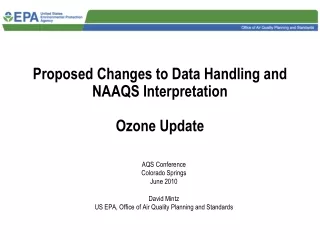
Chemical processes Lower stratosphere: inorganic bromine Figure 2 Assessment of Stratospheric Aerosol Particles (ASAP) reconstruction of the tropical (solid line) and northern midlatitude (dotted). Aerosol loading during the past 20yrs has varied by as much as 2 orders of magnitude.
Solar cycle variation Figure 3. Annual mean solar cycle response calculated from two long-term satellit ozone profile datasets with predictions of four stratospheric models for 11-year changes in solar uv spectral irradiance for, (a) Signal in ozone averaged over 55ºS-55ºN. (b) Only the tropical response in 25ºS-25ºN. Near stratopause(50km),observed response appears to be larger than expected models while in the middle stratosphere(30-35km)is the reverse.
Summary • Both empirical and model studies using observed circulation changes continue to indicate that a major fraction (almost 50% in February-March) of the observed column ozone trends at northern midlatitudes from 1979 to mid-1990s can be attributed to long-term changes in lower stratospheric circulation. • The inclusion of additional inorganic bromine (Br) from short-lived substances (VSLS) in models leads to large ozone destruction at midlatitudes,compared with studies including only long-lived bromine source gases. • Identification of solar cycle signal in observed ozone has been improved due to the absence of major volcanic erruptions over the past 15 years.