Download
1 / 67
670 likes | 945 Vues
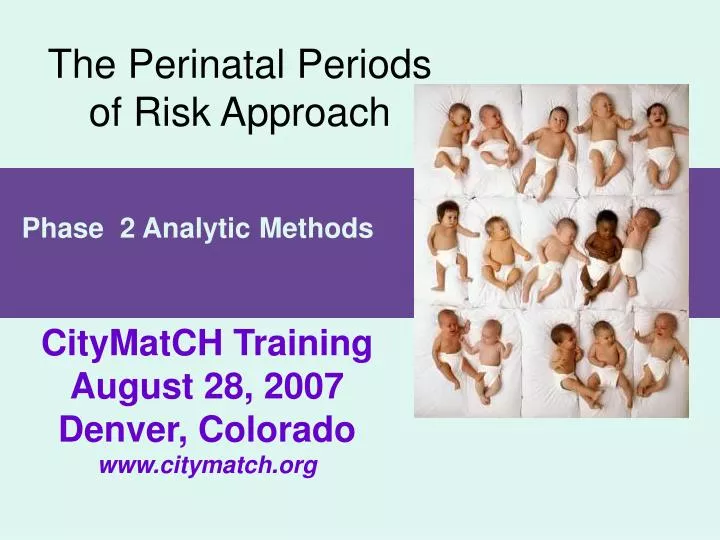
The Perinatal Periods of Risk Approach. Phase 2 Analytic Methods. CityMatCH Training August 28, 2007 Denver, Colorado www.citymatch.org. 6 Basic Stages: Perinatal Periods of Risk Approach. Stage 1: Assure Analytic and Community Readiness Stage 2: Conduct Analytic Phases of PPOR

E N D
The Perinatal Periods of Risk Approach Phase 2 Analytic Methods CityMatCH Training August 28, 2007 Denver, Colorado www.citymatch.org
6 Basic Stages:Perinatal Periods of Risk Approach Stage 1: Assure Analytic and Community Readiness Stage 2: Conduct Analytic Phases of PPOR Stage 3: Develop Strategic Actions for Targeted Prevention Stage 4: Strengthen Existing and/or Launch New Prevention Initiatives Stage 5: Monitor and Evaluate Approach Stage 6: Sustain Stakeholder Investment and Political Will
Maternal Health/ Prematurity Maternal Care Newborn Care Infant Health PPOR Maps Fetal & Infant Deaths Age at Death Fetal Death Post- neonatal Neonatal Birthweight 500-1499 g 1500+ g
PPOR Analytic Methods Analytic Preparation Acquire, assess, and process data files Phase I Analysis Identifies the populations and periods of risk with the largest excess mortality Phase 2 Analysis Explains why the excess deaths occurred and directs prevention efforts
PPOR Analytic Preparation • Fetal death certificate files (24+ wks, 500+ grams) • Infant death certificate files (500+ grams) • Live birth files (500 + grams) • Linked birth—infant death certificate files are needed to find birth information for the infants who died • Spontaneous and induced abortions are NOT included (they are not given certificates)
97 Maternal Health/ Prematurity (35 fetal deaths, 62 live births) 48 Maternal Care (fetal deaths) 44 Newborn Care (live births) 47 Infant Health(live births) PPOR Map of Feto-Infant Deaths Urban County, All Races2000-2002 236 Feto-Infant Deaths 23,282 live births and fetal deaths
2.1 Maternal Care 1.9 Newborn Care 2.0 Infant Health Calculating Feto-Infant Mortality Rate Urban County, All Races2000-2002 4.2 + 2.1 + 1.9 + 2.0 = 10.1 Period rates add up to overall rate (except for round-off error) Maternal Health/ Prematurity Rate=deaths x 1,000 ÷ births =97 deaths x1,000 ÷ 23,282 = 4.2
2.2 1.1 1.0 1.5 USA Reference Group 1998-2000 • Defined by maternalcharacteristics • 20 or more years of age • 13 or more years of education • Non-Hispanic white women • residents of the US at the time of baby’s birth Total Fetal-Infant Mortality Rate=5.9
Calculating ExcessRatesOverall populationUrban County, 2000-2002 (external reference group) ____________________________________________________________
0.8 Maternal Care .8 Newborn Care 1.0 Infant Health Excess Feto-Infant Mortality(Urban County All Races2000-2002vs National Reference Group) Two of the largest “gaps” in Urban County were in the Maternal Health/ Prematurity and Infant Health Periods of risk. They account for nearly 70% of excess deaths. Maternal Health/ Prematurity 2.0
Phase 2 Analysis --- Steps • Identify causal pathways or biologic mechanisms for excess mortality • Estimate prevalence of risk and preventive factors by type of mechanism • Estimate the impact of the risk and preventive factors.
PPOR Phase 2 Analysis Three Directions • Community health and health systems assessment • Fetal Infant Mortality Reviews (FIMR) • Further epidemiologic study
PPOR Phase 2 AnalysisLimitations • Since models are complex and effect sizes are small, a large number of deaths may be needed to obtain statistically significant results, even when factors are “known”. • Observational studies do not generally show causal link, so PPOR is unlikely to identify previously unknown causes.
How can we most effectively determine where and why the excess deaths?
PPOR Phase 2 Analysis Strategy • Eliminate from consideration factors that are unlikely to be contributing • Find and target factors that are likely to be contributing
PPOR Phase 2 AnalysisStrategy A factor is a likely contributor if: • It is KNOWN to cause prematurity or death based on scientific literature. • It is MORE PREVALENT in a population with excess deaths Further analysis can help prioritize among likely contributors
Maternal Health/ Prematurity Preconception Health Health Behaviors Perinatal Care Prenatal Care High Risk Referral Obstetric Care Maternal Care Perinatal Management Neonatal Care Pediatric Surgery Newborn Care Sleep Position Breast Feeding Injury Prevention Infant Health There are many possible interventions for each period of risk.
Phase 2 Analysis Plan • Protocols were developed for MH/P and IH • Possible strategies have been outlined for MC • Phase 2 analysis plan depends on • Phase I results • Availability of data • Community priorities and resources
PPOR Phase 2 AnalysisUseful Epidemiological Tools • Kitagawa • Relative Risk • Odds Ratio • Population Attributable Risk • Logistic Regression • Poisson Regression • Multi-level Modeling
Phase 2 Preparation of Data for Epidemiologic Analysis The DEATH CERTIFICATE is the source of • Age at death • Cause of death The BIRTH CERTIFICATE is the source for • Maternal characteristics • Geo-coding (mother’s residence) • Circumstances of the birth • Condition of newborn
Phase 2 Preparation of Data for Epidemiologic Analysis • Use a birth cohort which includes all babies born within the agreed timeframe (year X). • Link deaths from that cohort with their birth certificate (some of these deaths occur in year X+1) • Add to that the fetal deaths for year X, with a variable indicating the outcome.
Birth Versus Death Cohort Births Birth Cohort Deaths 1999 2000 Births Death Cohort Deaths 1999 2000
Creating a Birth Cohort from a Death Cohort (throw away one year)Use Birth File for year 2000, Linked Death Files from Year 2000 and 2001
Phase 1 & 2 Data Preparation:Develop a Combined Study File • Use a birth cohort file of infant deaths linked live births. • If a period or death cohort file, convert to a birth cohort file • Combine linked birth/death file and live birth file for the same year. • Add fetal deaths for the same year with a variable indicating the outcome.
Phase 2 Data Preparation:Utilizing other Data Sources • Pregnancy and Pediatric Nutrition Surveillance Systems • Newborn screening • Hospital discharge systems • Child abuse reporting systems • Hospital Discharge Records • PRAMS • FIMR (usually qualitative data only) • Neighborhood-level data could be linked to the dataset.
Maternal Health/Prematurity Period Phase 2: Identify causal pathways or biologic mechanisms for excess mortality Cause of VLBW fetal and infant deaths is • Multifactorial • Complex • Inconsistent • Varies by training ICD-10 Cause of Death Codes are not very helpful
Maternal Health/Prematurity Period Phase 2 : Identify causal pathways or biologic mechanisms for excess mortality KITAGAWA ANALYSIS A more useful alternative is using Kitagawa’s formula to algebraically partition excess mortality into two portions: • birthweight distribution • birthweight specific mortality
KITAGAWA’S FORMULA • an excel sheet at www.citymatch.org will do these calculations for you, if you give it some local data
Maternal Health/Prematurity Period Kitagawa Analysis (Birthweight under 1500 grams)African Americans in Example City vs U.S. Reference Group
Phase 2 Analysis: Maternal Health/Prematurity Protocol depends on result of Kitagawa. Maternal Health/ Prematurity OUTCOME DENOMINATOR All Births And Fetal Deaths Birthweight Distribution Percent VLBW Birthweight- Specific Mortality VLBW Births and Fetal Deaths Mortality Rate
Should fetal deaths be included in study of Maternal Health/Prematurity birthweight distribution pathway? • The prevalence of risk factors may not be known among fetal deaths (for example PRAMS data). • Given that the fetal deaths included in PPOR analyses make up less than 1% of all births in most communities, excluding these events will have little impact on the analysis.
Smoking Prenatal care Race Maternal age Parity STD/Bacterial Vag. Multiple Preg. SES/Education Birth Interval Maternal HTN/Diabetes Gestational age Referral system Perinatal care Mat. complications Neonatal conditions Pay source Phase 2 Analysis: Maternal Health /Prematurity Risk and Preventive Factors. Birthweight Distribution (VLBW Births) Birthweight- Specific Mortality
IN EXAMPLE CITY, Kitagawa analysis showed Black Excess Mortality was due to Birthweight Distribution. Next Step:EXAMINE DISPARITIES IN RISK FACTORS
IN EXAMPLE CITY, Kitagawa analysis showed Black Excess Mortality was due to Birthweight Distribution. Next Step: EXAMINE DISPARITIES IN RISK FACTORS • Maternal Smoking : white rate is significantly higher than black rate • Multiple Gestations: white rate is not significantly higher than black rate • Late or No Prenatal Care: black rate is significantly higher than white rate • Maternal Age <20: black rate is significantly higher than white rate
Example City FIMR Results(1995-2002) • Maternal Health and Prematurity (N=45) • 44% Preterm labor • 38% PROM • 31% Maternal infections other than STDs • 31% PPROM • 27% Infections (baby) • 27% History of fetal/infant loss • 22% Pre-existing medical condition (baby) • 22% Substance abuse
Maternal Health/Prematurity Period Phase 2 Analysis: Estimate the impact of risk and preventive factors If the number of deaths and quality of data are sufficient, logistic or Poisson regression modeling can help us: • DETERMINE which of the known factors are significant contributors in our community. • ADJUST for the correlation among the factors.
Comparison Adjusted Odds-Ratio 95% Confidence Interval White Hispanics vs. Non-Whites Hispanics 1.105 0.896-1.362 Black Non-Hispanic vs. White Non-Hispanics 1.667 1.364-2.038 Phase 2 Studies -- Association of Risk Factors on Low Birth Weight Births 1999 Race Using logistic regression to examine effect of race on low birthweight, adjusting for: Age, Marital Status, Number of Pre-natal visits, Birth weight gain, mother’s education, mother’s tobacco use and mother’s alcohol use and gestational period. Odds of low birth weight are significantly higher for Black Race than for White Non-Hispanics (odds ratio significantly higher than 1). White Hispanics did not have significantly higher odds of being low birthweight.
Race/Ethnicity Risk Factors Adjusted Odds-Ratio Whites/Non-Hispanics Plurality/Multiply Births 39.555 Birth weight gain 2.640 Mother’s education 1.430 Mother’s tobacco use 1.77 White Hispanics Plurality/Multiply Births 38.32 Birth weight gain 2.56 Inadequate Health care 0.612 Birth Mother’s Age 2.477 African-American Plurality/Multiply Births 21.874 Birth weight gain 2.345 Inadequate Health Care 0.700 Phase 2 StudiesRisk Factors Associated With Low Birth Weight Adjusted and Stratified By Race 1999
Kathy Carson, Seattle, with a local Phase 2 Maternal Health/Prematurity story
Phase 2 Analysis---Infant health period Identify causal pathways or biologic mechanisms for excess mortality • Use Underlying Cause of Death from Death Certificate • We recommend categorizing according to CDC/NCHS Postneonatal Mortality Surveillance System • birth defects • infections • injuries • perinatal conditions • SIDS/SUID
Phase 2 Analysis-Infant health periodIdentify causal pathways or biologic mechanisms for excess mortality Infant Health Each cause category has its own set of Risk Factors SIDS Injury Infection Anomalies Perinatal
Phase 2 Analysis-Infant health periodIdentify causal pathways or biologic mechanisms for excess mortality In each Study and Reference Population , CSMR=Cause-specific mortality rate the number of deaths due to Cause X number of live births>=1500g Excess CSMR = Study Pop. CSMR – Ref. Pop CSMR