Download
1 / 15
150 likes | 237 Vues
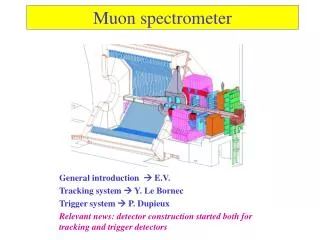
A Study of Back Diffusion in the ATLAS Muon Spectrometer Gas System. Gordon Berman University of Michigan Advisors: Bing Zhou, Dan Levin, and Zhengguo Zhao. ganesh.physics.lsa.umich.edu/~atlas/. The ATLAS Detector. The Muon Gas System.

E N D
A Study of Back Diffusion in the ATLAS Muon Spectrometer Gas System Gordon Berman University of Michigan Advisors: Bing Zhou, Dan Levin, and Zhengguo Zhao
ganesh.physics.lsa.umich.edu/~atlas/ The ATLAS Detector
The Muon Gas System • Supply drift gas (93% Ar, 7% CO2) to 1194 Monitored Drift Chambers, containing 371,488 tubes, keeping them at a pressure of 3 atmospheres • Tubes specified to leak at a rate of less than 10-8 L*Bar/Sec • Back-diffusion of contaminants (N2, O2, H2O) into the tubes limited to 100 parts per million (ppm) • ATLAS specs assume that the leak rate equals the contamination rate Question: What is the contamination rate resulting from a typical chamber leak?
Why Do We Care? • Contaminants alter the time-space function of an MDT, causing a degradation in resolution • Contaminants also “eat up” drift electrons, which results in a smaller signal and less efficiency, as well as reduced resolution • Leak checking is very costly in terms of time, money, and expertise—especially with the stringent ATLAS leak specifications.
Cerutti, et al. 17 June 2002 TDC spectra Gas with air is faster
My Project for the Summer • Calculate the contamination rate for a common leak geometry • i.e.--fibers or dirt in O-rings, pinched O-rings, defective O-rings (notice a pattern?) • Create a model describing worst case scenarios and use its results as an upper limit • Consider the impact of relaxing the ATLAS leak specifications
My Model’s Assumptions 1) Perfectly cylindrical leak pathway used to model a leak caused by a fiber or hair • As a N2 or O2 molecule traverses the pathway, it will run into many “effective cross sections” of Argon gas • The molecule will bounce back and forth until it is either ejected or it passes through the cylindrical leak pathway • Very few collisions between the contamination molecules • All collisions are classical (elastic) • It should serve as anupper-bound
Ar What an Effective Cross-Section Is (Kind of) Probability of N2 Passing Through 1 X-Section ~ 99.866% Number of X-Sections per mm ~ 422,000
Calculation of Contamination Rate Using the simulated diffusion rate (D): # Molecules diffusing into tube per second = NC NC = A * G *D, where G = p*(2pm*kT)-1/2 Contamination Composition (by mass) = C C = (NC*mC) / ((NAr–NL) * mAr + NC * mC ) A = cross-sectional area of the leak mC = mass of 1 contaminant molecule mAr= mass of 1 Argon atom NL = # of Argon molecules escaping from the leak
Simulation Results • For Rleak=5 mm , Lleak = 1 mm, LMDT=2.16m (similar to a small fiber): • Rate of Passage in N2,O2 molecules ~ .16 +/- .002 % • Leads to an N2 Contamination Rate of: ~ 15.3 ppm per leak*day (by mass) • And an O2 Contamination Rate of: ~ 3.10 ppm per leak*day (by mass) • Total Estimated Contamination Rate ~ 20 ppm per leak*day
Conclusions • Having a leak at this level should not bring the contamination level of a given tube to above ATLAS specifications (100 ppm) • This is because the gas will be flushed at a rate of about 1 volume per day and will be replaced at a rate of about 1 volume per 10 days • Also, the simulation assumes conditions worse than an actual leak would create • Hence, the ATLAS leak specifications can be relaxed by at least a factor of 5 (most likely by a factor of 10) from a contamination perspective. • A more accurate back diffusion estimate can be determined through empirical measurements – a study is currently in progress at UM (Dan Levin)
Acknowledgements • Bing Zhou, Dan Levin, Zhengguo Zhao, Rudi Thun, and the rest of the University of Michigan ATLAS Group • Homer Neal, Jean Krisch, and Tom Dershem for organizing the U. of Michigan CERN REU Program • The National Science Foundation • Ford Motor Company • The CERN Summer Students Program
References -Andrews, F. Equilibrium Statistical Mechanics, 2nd ed. (Wiley, New York, 1975). -Cerutti, F. “MDT Performance with Air Contamination.” 17 June 2002. -Crank, J. The Mathematics of Diffusion, 2nd ed. (Oxford Science Publications, Oxford, UK, 1975). -Liboff, R. Kinetic Theory. (Prentice Hall, Englewood Cliffs, NJ, 1990). -ATLAS Muon Spectrometer Technical Design Report. 25 May 1999.