Download
1 / 22
220 likes | 324 Vues
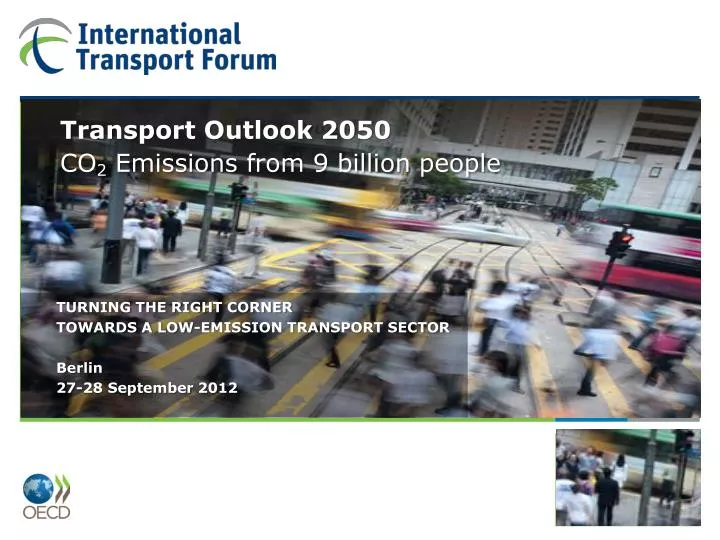
Transport Outlook 2050 CO 2 Emissions from 9 billion people. Plenary 2: Towards a Green Economy ITF Transport Outlook . Transforming Transportation Washington DC 26 January 2012. TURNING THE RIGHT CORNER TOWARDS A LOW-EMISSION TRANSPORT SECTOR Berlin 27-28 September 2012.

E N D
Transport Outlook 2050 CO2 Emissions from 9 billion people Plenary 2:Towards a Green Economy ITF Transport Outlook Transforming Transportation Washington DC 26 January 2012 • TURNING THE RIGHT CORNER • TOWARDS A LOW-EMISSION TRANSPORT SECTOR Berlin 27-28 September 2012
Global passenger transport activity 2010 – 2050 Index of pkm (2010 = 100) OECD • Economy returns to pre-crisis output trends • Policy priority to private ownership and use accommodation • No return to pre-crisis output trends • Private demand management and further development of public transport supply Source: International Transport Forum calculations using IEA MoMo version 2012.
Global passenger transport activity 2010 – 2050 Index of pkm (2010 = 100) Non-OECD • Economy returns to pre-crisis levels • Rapid urbanization while policies enable following OECD private vehicle ownership patterns • No return to pre-crisis output trends • Rapid urbanization is defined by active private demand management, land use policy and development of public transport Source: International Transport Forum calculations using IEA MoMo version 2012.
Global passenger transport activity 2010-2050 • Growth is expected to be much higher outside the OECD leading to total passenger transport flows around 3.6 times as large in 2050 as in 2010 • This assumes that car ownership and use follow historical patterns observed in OECD Europe / Japan • Discouraging car ownership and use reduces mobility growth and also diverts mobility to two-wheelers and to public transport. • Our “low car ownership” scenario indicates that outside the OECD two-wheeler use allows mobility to develop as quickly as in the “high car ownership” scenario at moderate income levels.
Global freight transport activity, 2010 – 2050, baseline and decouplingIndex of tkm (2010 = 100) • Economy returns to pre-crisis trends • Transport intensity of GDP equal to unity • Economy returns to pre-crisis trends • Decoupling of surface freight from GDP Source: International Transport Forum calculations using IEA MoMo version 2012.
Global freight transport activity, 2010 – 2050, baseline and decouplingIndex of tkm (2010 = 100) • Economy returns to pre-crisis trends • Transport intensity of GDP equal to unity • Economy returns to pre-crisis trends • Decoupling of surface freight from GDP Source: International Transport Forum calculations using IEA MoMo version 2012.
Freight transport activity 2010-2050 • Global freight tonne-km to rise 2–4 times by 2050 • Low scenario: Decoupling of tonne-km from GDP growth • Rapid dematerialisation • Active policies to dampen freight transport growth • High scenario: GDP growth returns to pre-crisis trends and remains transport intensive with unitary elasticity • Evidence from OECD countries supports high freight transport intensity of GDP • Developing countries may be embarking on a relatively freight intensive growth path, this upside risk is reflected in the high scenarios
Shift in centre of gravity from OECD to non-OECD countries (baseline scenarios) Source: International Transport Forum calculations using IEA MoMo version 2012.
High Scenarios • Best interpreted as where demand “would like to go” • Realistic? Policy intervention? • Urbanisation policies might slow growth of car ownership and use • High energy prices would suppress growth • ….. • But high scenarios far from impossible
CO2 emissions from passenger mobility • CO2 emissions rise less quickly than mobility through fuel economy improvement and technological change • In the OECD, the CO2-saving effect of technological change is sufficiently large that emissions from passenger transport stabilize or even decline despite the transport volume growth of around 30% • Outside the OECD, the fast growth of mobility and the switch to more CO2-intensive modes imply a large increase in emissions that is only mildly tempered by technological change. The increase is expected to be between 1.5 and 3 times 2010 levels
Global CO2 emissions from total private mobility index (2010 = 100) Non-OECD OECD Source: International Transport Forum calculations using IEA MoMo version 2012.
CO2 emissions from freight transport • CO2 emissions rise less quickly than mobility through fuel economy improvements and these improvements are larger in the OECD than outside the OECD • Due to expected changes in the commodity mix outside the OECD, CO2 projections in the high scenario may be conservative given the possibility of an increasing share of road freight
Global CO2 emissions from total freight mobility index (2010 = 100) Source: International Transport Forum calculations using IEA MoMo version 2012.
Global CO2 emissions from transport • Globally CO2 emissions from transport are expected to be 1.5 to 2.5 times higher by 2050 compared to 2010 values • In the OECD, stronger growth in demand for freight transport mitigates some of the technological improvements in private mobility in terms of emissions • Outside the OECD stronger growth in both passenger and freight mobility together with less technological change puts additional pressure on global emissions • In total emissions from transport are to rise by a factor of 2.4 to 4.5 outside the OECD
Global CO2 emissions from transport, index (2010 = 100) GDP recovery, high car ownership and GDP intensity of freight transport equal to unity GDP recovery, low car ownership and decoupling of freight transport from GDP Source: International Transport Forum calculations using IEA MoMo version 2012.
Global CO2 emissions from transport,by transport mode for passenger and freight, metric-tonnes of CO2 equivalent Source: International Transport Forum calculations using IEA MoMo version 2012.
Passenger Modal Split by region, 2010 and 2050 baseline scenario, p-km (%) OECD Non-OECD Source: International Transport Forum calculations using IEA MoMo version 2012.
Global CO2 emissions from light duty vehicles • Maximisation of cost effective fuel economy improvement around the world • GFEI target: 8 l/100km for new fleet in 2008 4 l/100km in 2030; & for whole fleet in 2050 • through continued progress with car emissions standards would stabilise emissions • Impressive but not enough to for IPCC 450ppm CO2 limit
An example on Urban development and car use policies Motorization Rates in Shanghai and Beijing in Relation to GDP per Capita
Effective Policies for Lower Emissions from Transport • Vehicle and fuel Technology - fuel economy (ICE) and low carbon energy vectors • Improved Public Transport service through ITS • Urban land use and car use • Just like transport generates emissions, inadequate land use generates excessive transport • Regulation & Prices on ownership, access and parking • Prices in general reflecting use of resources (costs) as well as value for users and for society • Coordinated Use of Multiple Instruments • Technology + integrated planning + regulation & prices
Thank you Plenary 2:Towards a Green Economy ITF Transport Outlook Transforming Transportation Washington DC 26 January 2012 • Jose Viegas, • Secretary General