Download
1 / 17
170 likes | 264 Vues
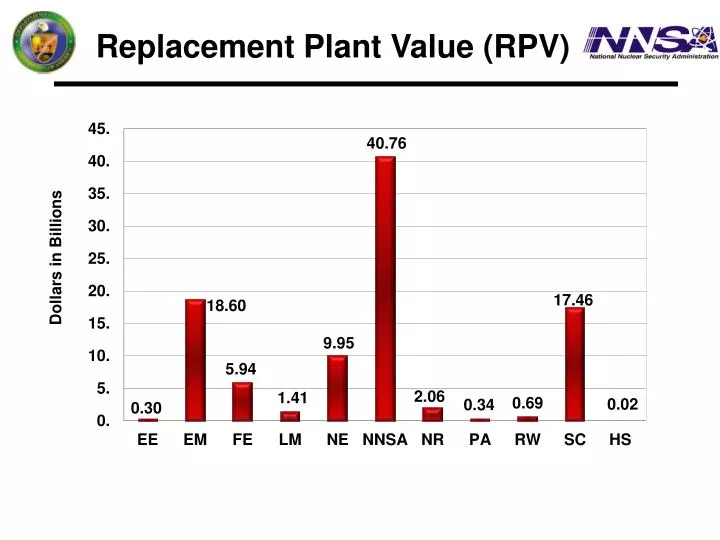
Replacement Plant Value (RPV). Dollars in Billions. Deferred Maintenance (DM). Dollars in Millions. Facility Condition Index (FCI). FCI (%). DOE Gross Square Feet (GSF). Number in Millions. NNSA Condition of Enterprise. % of Total Enterprise by Number of Facilities.

E N D
Replacement Plant Value (RPV) Dollars in Billions
Deferred Maintenance (DM) Dollars in Millions
Facility Condition Index (FCI) FCI (%)
DOE Gross Square Feet (GSF) Number in Millions
NNSA Condition of Enterprise % of Total Enterprise by Number of Facilities
NNSA Condition of Enterprise % of Total Enterprise by GSF
NNSA Deferred Maintenance Backlog and Facility Condition Index (FCI)
Deferred Maintenance Condition Index (ACI) Good: ACI > .95 Fair: ACI between .9 and .95 Poor: ACI < .9 NNSA: CI and Backlog prediction Model (Includes Inflation) ($000) FIRP Completes its Mission
Facility Condition Index by Mission Dependency
Facility Condition Index for MC & MDNC
Impact of FIRP on Legacy Deferred Maintenance (DM) Buy down ($M) 900 M
NSE Transformation – Excess Disposition FY 2002 – FY 2009
NNSA IFI Elimination of Excess FY 1990 – FY 2010 Data source: FY90 – FY01: “SPEIS” chart FY02 – FY04: TYSP & FIMS adjustment for OST, SC & OR FY05 – FY10: FIMS snapshot
NNSA Owned, Permitted and • Leased Facilities • NNSA owns the vast majority of its assets: 7,656 of 7,932. The remainder are permitted or leased directly by DOE, contractor, or GSA.
Number of Facilities Mission Critical (MC) and Mission Dependency Not Critical (MDNC)