Download
1 / 1
10 likes | 207 Vues
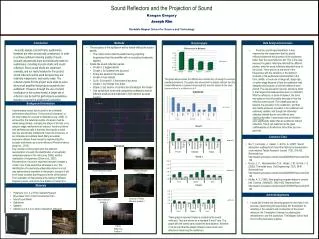
Fold or cut poster here. Fold or cut poster here. Fold or cut poster here. Fold or cut poster here. Sound Reflectors and the Projection of Sound Kaegan Gregory Joseph Kim Rockdale Magnet School for Science and Technology. Introduction . Data Analysis/Conclusion . Methods .

E N D
Fold or cut poster here Fold or cut poster here Fold or cut poster here Fold or cut poster here Sound Reflectors and the Projection of Sound Kaegan Gregory Joseph Kim Rockdale Magnet School for Science and Technology Introduction Data Analysis/Conclusion Methods Data Analysis • Acoustic spaces (concert halls, auditoriums, theaters) are often acoustically unbalanced. In order to achieve optimum listening quality of music, acoustic adjustments must be individually made for auditoriums, including acoustic shells and sound reflectors. Since sound shells are expensive, unwieldy, and not really feasible for this project, sound reflectors will be used because they are relatively inexpensive, and easily made. The reflectors made for this project were scale to suit a fairly small amplifier that projects sound into the auditorium. However, through the use of sound localization in this scaled model, a larger set of reflectors can be built for performance ensembles that also corrects the auditorium’s acoustics. • The acoustics of the auditorium will be tested without the sound panels. • The control was to test the auditorium by projecting frequencies from the amplifier with no acoustical treatments applied. • Create the sound reflection panels • Create 4, 2 legged stands • Create 4, 3x2 panels from ply wood • Screw the panels to the stands • Create 4 more stands • Cut 6, 3 foot and 6, 2 foot strips of ply wood • Create 3, 3x2 frames from them • Staple 3, 3x2 section of construction sheeting to the frames • Use sound level meter and composition software to test for different positions and materials to find optimum acoustic position • From the overall experimentation, it was observed by the researchers that the plastic reflectors balanced the acoustics of the auditorium better than the wood reflectors did. This is the case because the plastic reflectors reflected the different pitches, while the wood reflectors absorbed more of the sound. There was not a real trend in the frequencies with the reflectors of the different locations in the auditorium tested whether in the front, middle, or back row or stage left, stage right, or center stage because of how the auditorium was designed and because of how the reflectors were placed. The raw acoustics however, showed a trend in the frequencies because there were no reflectors. With the reflectors, in terms of balance, the trend was going on and off possibly because of how the reflectors were placed. The overall goal was to balance the acoustics in the auditorium, and that was mostly achieved. Acoustics in an auditorium are extremely variable, and though the inferential statistics showed that no one reflector was significantly better, it was shown that all reflectors were significantly better than an auditorium without reflectors. This is just testament to the great craftsmanship of all reflectors rather than just one good set. • The graph above shows the differences in balance by showing the average standard deviations. The graph also shows that the plastic reflector had the lowest differences in balance meaning that it was the closest to the ideal balance which is a difference of 0. Background Information A performance center that is used for an orchestral performance should have 1.9 seconds of resonance, or the time it takes for a sound to dissipate (Long, 2006). To achieve this, the natural acoustics of a space must be edited using plasters, changing the shape of the hall, or by using on stage mechanisms for balance. Another problem with performance halls is that they have spots in which they are acoustically unbalanced, have low resonance, or are otherwise acoustically dead. Many acoustical engineers address these issues by implementing the acoustic tools known as sound reflectors (Precision fabrics group Inc., 2012). Key concepts in this project were the optimum reverberation of sound, the identification of acoustically undesirable places in the hall (Long, 2006), and the localization of frequencies (Chen et al., 2003). Reverberation of sound is important because it creates a certain color to the sound that otherwise is lost. The identification of acoustically undesirable places in a hall was extraordinarily important to this project, because it will be at those locations that frequency levels will be tested. The localization of frequencies is the testing of different frequency levels, and will be how balance is tested in a hall. . Literature Cited • Na, Y., Lancaster, J., Casali, J., & Cho, G. (2007). Sound absorption coefficients of micro-fiber fabrics by reverberation room method. Textile Research Journal, 77(5), 330-335. Retrieved from http://search.proquest.com/docview/236505364?accountid=50132 • Bocox, J. C., Hasselwander, G. B., Hargis, J. M., & Ford, J. S. (2002). The inside story. Civil Engineering, 72(7), 56-61. Retrieved from http://search.proquest.com/docview/228497050?accountid=50132 • Moffat, A. S. (1989). New graphics program debuts in concert hall. Science, 245(4925), 1452-1452. Retrieved from http://search.proquest.com/docview/213535009?accountid=50132 Revisions: Wood reflectors position 1 Plasticreflectors position 2 Materials • Plytanium 1/4 x 4 x 8 Pine Sanded Plywood • Blue Hawk 10-ft x 100-ft Construction Film • Sound Level Meter • Auditorium • Speaker • Ableton Live 8.2.2 (or other composition software) Acknowledgements Close up of Plastic reflectors position 2 Wood reflectors position 2 • I would like to thank the following people for their help in the process of performing this experiment. Mr. Scott Bolen for assisting in the research and construction of the sound reflectors. Mr. Christopher Coleman for allowing the researchers to use the auditorium. The Magnet School fund for providing necessary supplies. These graphs represent balance created by the sound reflectors. They are shown on a standard X and Y axis. The graph with the lowest bars created the best balance, therefore, it can be said that the plastic reflectors were much more effective in balancing the auditorium. Plastic Reflectors Position 1 Citation