Download

1 / 24
250 likes | 466 Vues
Vibrational Spectroscopy for Pharmaceutical Analysis. Part IX. Introduction and Origin of NIR Bands Rodolfo J. Romañach, Ph.D. NIR Fundamentals: Electromagnetic Spectrum. 12,500 cm -1 (800 nm). 4,000 cm -1 (2500 nm). Frequency (cm -1 ). -Ray. X – Ray. Ultraviolet. v i s i b l e.

E N D
Vibrational Spectroscopy for Pharmaceutical Analysis Part IX. Introduction and Origin of NIR Bands Rodolfo J. Romañach, Ph.D.
NIR Fundamentals: Electromagnetic Spectrum 12,500 cm-1 (800 nm) 4,000 cm -1 (2500 nm) Frequency (cm-1) -Ray X – Ray Ultraviolet visible NIR MIR FIR ESR NMR Region Infrared Microwave Radio, TV Waves NuclearTransitions InnerShell Electronic Transitions ValanceElectron Transitions MolecularVibrations MolecularRotations SpinOrientation in MagneticField Interaction Wavelength (m) Courtesy Bruker Optics
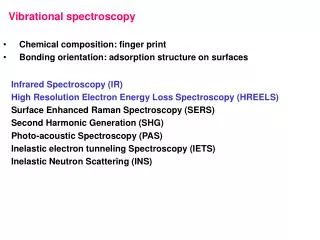
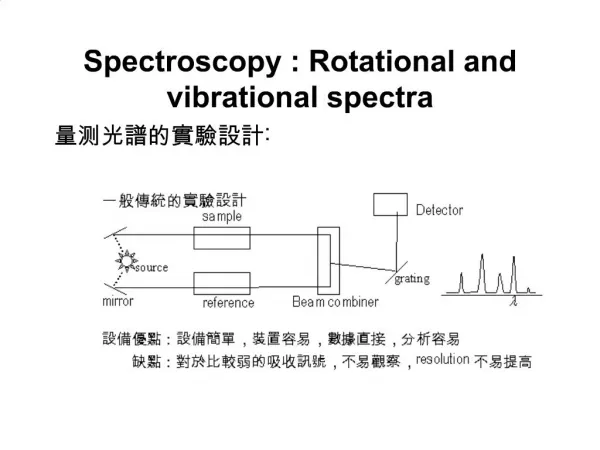
Regions of Infrared Spectrum: Far Infrared: 650 – 25 cm-1 Mid Infrared: 4000 – 650 cm-1 Near Infrared: 12800 – 4000 cm-1(0.8 - 2.5 m, or 800- 2500 nm) A vibration occurs when the dipole moment of the molecule changes, and the molecule interacts with radiation equal to the frequency of vibration. Infrared Spectroscopy
Infrared Spectroscopy (mid-IR) and Near Infrared Spectroscopy • Infrared Spectroscopy (mid-IR), studied in organic chemistry courses; principal identification method in pharmaceutical industry. • Mid-IR sharp bands that provide structural information on compounds; better than fingerprint. (region of 4000 cm-1 to 400 cm-1, wavelengths from 2.5 m to 25 m). • Near IR weak overlapping bands; difficult to interpret (region of 12500 to 4000 cm-1, wavelengths from 0.8 to 2.5 m.)
Process Applications: Excellent analytical method for the study of solids. Spectra may be obtained in non-invasive manner. Remote sampling is possible (good for hazardous materials). Possibility of using it in a wide range of applications (physical and chemical), and viewing relationships difficult to observe by other means. Laboratory Applications: Sample preparation is not required leading to significant reductions in analysis time. Waste and reagents are minimized. Advantages of NIR
Spectroscopy of the Solid State • Spectroscopy - Interaction between radiation and matter. • NIR – offers possibility of study of interaction of solids with radiation since sample preparation is not required.
Disadvantages of NIRS • Calibration requires careful experimental design. • Depends on accuracy of reference methods. • Overlapping bands, not easy to interpret. • Differences in spectra are often very subtle. • Usually not for trace level analysis. • The implementation of NIR requires a significant investment in Human Resources.
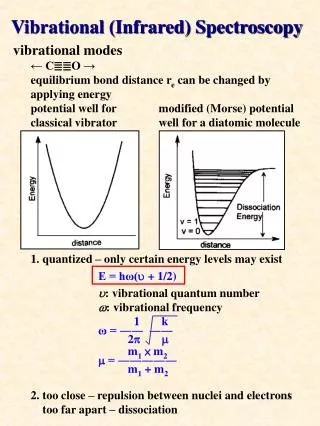
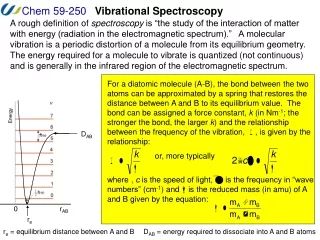
Vibration Theory The molecule can be thought of as mass m1 and m2 connected by a spring. At equilibrium, the distance between the two masses is r0. If the molecule is stretched by an amount r = x1 + x2, then a restoring force, F, is produced. If the spring is released, the system will vibrate around the equilibrium position. According to Hooke’s Law, for small deflections the restoring force is proportional to the deflection: F = -k . r Since the force acts in a direction opposite to the deflection, the proportionality constant, or force constant, k, is negative in sign. The force constant is called the spring constant in the mechanical model, whereas in a molecule the force constant is a measure of the bond strengthbetween the atoms. Courtesy Bruker Optics
Vibration Theory For the harmonic oscillator model, the potential energy well is symmetric. According to quantum-mechanical principles molecular vibrations can only occur at discrete, equally spaced, vibrational levels, where the energy of the vibration is given by: Ev=(v + ½) h v = 0, 1, 2, 3, ... Where h is Planck’s constant and v is the vibrational quantum number. Even in case of v = 0, which is defined as the ground vibrational level, a molecule does vibrate: Ev= ½ h Potential energy curve for a harmonic oscillator Based on Bruker Optics Slide
When absorption occurs, the molecule acquires a clearly defined amount of energy, (E = h ), from the radiation and moves up to the next vibrational level (v = +1). For a harmonic oscillator, the only transitions permitted by quantum mechanics are up or down to the next vibrational level (v = 1). Vibration Theory If the molecule moves down to the next vibrational level (v = -1), a certain amount of energy is emitted in the form of radiation. This is called emission. Based on Bruker Optics Slide
A Molecule Absorbs Infrared Energy when: • A vibration occurs where the dipole moment of the molecule changes, and the molecule interacts with radiation equal to the frequency of vibration.
- + - + - + Change in Dipole Moment during Molecular Vibrations • Must change for IR absorption to occur. • The dipole moment is a measure of the degree of polarity of molecule (magnitude of the separated charges times the distance between them). • A measurement of degree of unequal distribution of charges in molecule. H Cl
Units of spectra- nm, m, cm-1 Sometimes see cm-1 : • 10,000 cm-1 = (1/10,000) cm or 0.0001 cm = 1 m = 1000 nm • 6,000 cm-1 = (1/6000) cm or 0.000167cm = 1.67 m = 1670 nm • 5,000 cm-1 = (1/5000) cm or 0.0002 cm = 2 m = 2000 nm • 4000 cm-1 = (1/4000) cm or 0.00025 cm = 2.5 m = 2500 nm.
NIR Absorption - Overtones • A molecule has certain discrete energy levels. • In mid and near infrared spectroscopy molecules absorb energy when a photon matches frequency of vibration and the dipole moment changes. • The transition from the ground state to the second excited level is called an overtone, and is observed in the NIR spectral region.
NIR Absorption Bands • Absorption bands in the NIR are the result of combination and overtone bands from the fundamental vibrations of C-H, N-H, and O-H bonds seen in the mid-IR. • The overtone and combination bands are 10 – 100 X less intense than the fundamental bands in mid-IR. • Differences in spectra are often very subtle, requiring training of analysts to recognize these differences.
Combination Bands • Polyatomic linear molecules have 3N-5 modes of vibration. Non-linear have 3N – 6. • A transition that occurs simultaneously for two of these modes is called a combination band.
Interpretation of NIR Spectra • In Raman and mid-IR spectroscopy, the interpretation of spectra is possible and valuable information is gained in regards to the presence of functional groups. This type of interpretation is very difficult in NIR spectroscopy, due to significant overlapping of bands. In NIR spectroscopy we are usually interested in observing differences between spectra, and not in the interpretation of NIR spectra.
Overtones and combination bands of water (Fig. 9.1), Near Infrared Spectroscopy, Ed. Siesler, Ozaki, Kawata, Heise, Wiley 2002.
Chemists and the Interpretation of NIR Spectra • “Analytical chemists have been guilty of assigning NIR spectra to impossible combinations. Physical chemists wish to obtain a better understanding of the molecular dynamics from the intensities, bandwidths, and positions of the bands.” A.S. Bonanno, J. M. Olinger, and P.R. Griffiths, “The Origin of Band Positions and Widths in Near Infrared Spectra”, in Near Infra-Red Spectroscopy, Bridging the Gap Between Data Analysis and NIR Applications, Edited K.I. Hildrum, T. Isaakson, T. Naes, and A. Tandberg, Ellis Horwood, 1992.
Chemists and the Interpretation of NIR Spectra • “Chemometricians with a primary goal of determining the concentration of the analyte, and who sometimes have no interest in understanding the origin of features in NIR spectra provided that different compounds give rise to unique spectra.” A.S. Bonanno, J. M. Olinger, and P.R. Griffiths, “The Origin of Band Positions and Widths in Near Infrared Spectra”, in Near Infra-Red Spectroscopy, Bridging the Gap Between Data Analysis and NIR Applications, Edited K.I. Hildrum, T. Isaakson, T. Naes, and A. Tandberg, Ellis Horwood, 1992.
Chemists and the Interpretation of NIR Spectra • “In summary, therefore, the assignment of bands in near infrared spectra of large molecules can be exceedingly complicated even if, the like cyclohexane, the analyte would be expected to yield a simple spectrum. Indeed, it is quite possible that the rationale of chemometricians given in the first paragraph of this paper is the best approach”. A.S. Bonanno, J. M. Olinger, and P.R. Griffiths, “The Origin of Band Positions and Widths in Near Infrared Spectra”, in Near Infra-Red Spectroscopy, Bridging the Gap Between Data Analysis and NIR Applications, Edited K.I. Hildrum, T. Isaakson, T. Naes, and A. Tandberg, Ellis Horwood, 1992.