Download
1 / 1
10 likes | 111 Vues
Advantages of a Two-Pass Workflow for Biomarker Discovery in Plasma or Serum Samples for Clinical Research Maryann S Vogelsang 1 , Bryan Krastins 1 , David A Sarracino 1 , Michael Athanas 2 , Amol Prakash 1 , Alejandra Garces 1 , Gouri Vadali 1,2 , Janin Schulte 3 , Gaiané Demirdjian 3 ,

E N D
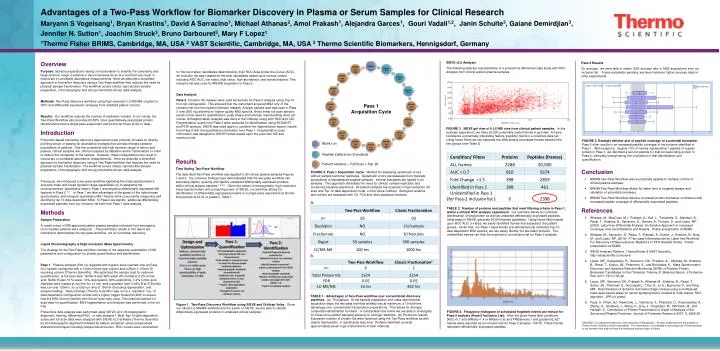
Advantages of a Two-Pass Workflow for Biomarker Discovery in Plasma or Serum Samples for Clinical Research Maryann S Vogelsang1, Bryan Krastins1, David A Sarracino1, Michael Athanas2, Amol Prakash1, Alejandra Garces1, Gouri Vadali1,2, Janin Schulte3, Gaiané Demirdjian3, Jennifer N. Sutton1, Joachim Struck3, Bruno Darbouret3, Mary F Lopez1 1Thermo Fisher BRIMS, Cambridge, MA, USA 2 VAST Scientific, Cambridge, MA, USA 3 Thermo Scientific Biomarkers, Hennigsdorf, Germany Overview Purpose: Sample preparations relying on fractionation to simplify the complexity and large dynamic range of plasma or serum samples do so at a cost that can result in inaccurate or unreliable abundance measurements. Here we describe a simplified approach to biomarker discovery using a Two-Pass workflow that reduces the need for physical sample fractionation. The workflow covers robust, reproducible sample preparation, chromatography and strong informatics-driven data analysis. Methods: Two-Pass discovery workflow using high-resolution LC/MS-MS coupled to ROC and differential expression analyses from stratified patient cohorts. Results: Our workflow reduces the number of replicates needed. In our hands, the Two-Pass Workflow also provides 20-50% more quantitatively-associated protein identifications than a single pass experiment and at shorter times (2-5X or less).. Introduction Proteomic-based biomarker discovery approaches have primarily focused on directly profiling serum or plasma for abundance changes that can discriminate between populations of patients. Due the complexity and high dynamic range of serum and plasma, clinical samples are often processed by depletion and/or fractionation in order to reduce the complexity of the sample. However, these manipulations can result in inaccurate or unreliable abundance measurements. Here we describe a simplified approach to biomarker discovery using a Two-Pass workflow that reduces the need for physical sample fractionation. The workflow covers robust, reproducible sample preparation, chromatography and strong informatics-driven data analysis. Previously, we introduced a two-pass workflow exploiting the mass spectrometer’s accurate mass and broad dynamic range capabilities, by investigating the uncompromised quantitative data in Pass 1 and targeting differentially expressed MS features in Pass 2 1,2. In Pass 1 we take advantage of the speed of the hybrid mass spectrometer, and measure quantitative MS1 frames while concurrently measuring and identifying top 10 data-dependent MS2. In Pass 2 we identify additional differentially expressed peptides from our inclusion list built from Pass 1 data analysis. Methods Sample Preparation A small cohort of IRB approved patient plasma samples collected from emergency room cardiac patients were analyzed . The preliminary results in this report are intended to demonstrate the two-pass workflow, not for biomarker discovery. Liquid Chromatography & High-resolution Mass Spectrometry The strategy for the Two-Pass workflow consists of the separate optimization of MS parameters and configuration for protein quantification and identification. Pass 1. Plasma samples (500 ng, digested with trypsin) were injected onto an Easy nLC system configured with a 10cmx100um trap column and a 25cm x 100um ID resolving column (Thermo Scientific). We optimized the sample load for optimum quantification, ie full scan data. Buffer A was 98% water 2% methanol 0.2% formic acid, Buffer B was 10 % water, 10% isopropanol, 80% acetonitrile, 0.2% formic acid. Samples were loaded at 4uL/min for 10 min, and a gradient from 0-45% B at 375nl/min was run over 130min, for a total run time of 150min (including regeneration, and sample loading). Velos-Orbitrap (Thermo Scientific) was run in a standard Top-10 data dependent configuration except with a higher trigger threshold (20K) to ensure that the MS2 did not interfere with the full scan duty cycle. This ensured optimal full scan data for quantification. MS2 fragmentation and analysis was performed in the ion trap. Proteomics data analysis was performed using SIEVE v2.0 chromatographic alignment, framing, differential ROC or ratio analysis 3. Both Top-10 data-dependent scans and full scan data were analyzed with SIEVE v2.0 software (Thermo Scientific) by chromatographic alignment followed by feature extraction using unsupervised statistical techniques including isotope deconvolution. ROC curves were constructed . SIEVE v2.0 Analysis The following data are representative of a proteomics differential case study with ROC Analysis from clinical patient plasma samples. Pass 2 Results On average, we were able to obtain 82% success rate in MS2 acquisitions from our inclusion list. Frame parameter pending, we have had even higher success rates in other experiments. for the top marker candidates determined by their ROC Area-Under-the-Curve (AUC). An inclusion list was created for the best candidates based upon various criteria including ROC AUC, low ratios, high ratios, high abundance, and low abundance. This inclusion list was used for MS/MS acquisition in Pass 2. Data Analysis Pass 2. Inclusion list masses were used exclusively for Pass-2 analysis using Top-10 from list configuration. This ensured that the instrument acquired MS2 only of the inclusion list (not the highest intensity) masses. A larger sample load was used in Pass 2 runs (630 ng) allowing for higher quality MS2 spectra. Since these full scan spectra would not be used for quantification, peak shape and intensity reproducibility were not crucial. All fragmentation analysis was done in the Orbitrap, using both HCD and CID. Fragmentation scans from Pass 2 were analyzed for identification using SEQUEST and FDR analysis. SIEVE was used again to combine the fragmentation search results from Pass 2 with the quantitative information from Pass 1. Fragmentation scan information was assigned to SIEVE frames based upon the precursor MZ and retention time Pass 1 Acquisition Cycle FIGURE 3. SIEVE gel view of 9 LC-MS runs from clinical patient samples. In this example experiment, we have 20,000 potentially useful frames in gel view. A frame represents a potentially interesting feature (peptide) found in a collective data set. Using frame filters we can separate the differentially expressed frames between the two groups (see Table 2). FIGURE 5. Example whisker plot of peptide coverage of a potential biomarker. Pass 2 often results in an increased peptide coverage of the proteins identified in Pass 1. With respect to roughly 10% of frames representing 1 peptide of a given protein in Pass 1, we identified a second peptide for that corresponding protein in Pass 2, ultimately strengthening the confidence in that identification and quantification. Results Time Saving Two-Pass Workflow The described Two-Pass workflow was applied to 60 clinical plasma samples Figures 1 and 2. Our previous findings have demonstrated that the two-pass workflow can accurately detect, quantify and identify unlabeled differentially expressed proteins within clinical plasma samples 1,2,4,5. Given the robust chromatography, high-resolution mass spectrometers and computing power of SIEVE, our workflow allows for identification of differentially expressed proteins in a single pass experiment at shorter time periods at (2-5x or greater), Table 1. • Conclusion • BRIMS Two-Pass Workflow was successfully applied to multiple cohorts of clinical plasma samples. • BRIMS Two-Pass Workflow allows for faster time to targeted assays and validation of potential biomarkers. • BRIMS Two-Pass Workflow delivers increased protein biomarker confidence with increased peptide coverage of differentially expressed peptides. • References • Athanas, M., MacCoss, MJ., Prakash, A., Kall, L., Tomazella, D., Maclean, B., Rezai, T., Krastins, B., Sarracino, D., Garces, A., Fortune, S., and Lopez, MF. (2009) Label-free Differential Analysis: An Iterative Approach to Increased Coverage, Improved Statistics and Results. Poster presentation at ASMS. • Athanas, M., Sarracino, D., Rezai, T., Prakash, A., Sutton, J., Krastins, B., Ning, M., and Lopez, MF. (2010) A Two-pass Informatics-driven Label-free Workflow For Discovery Of Neurovascular Mediators In PFO-Related Stroke. Poster presentation at ASMS. • SIEVE Analysis Platform, ThermoFisher & VAST Scientific, http://vastscientific.com/sieve • Lopez, MF., Kuppusamy, R., Sarracino, DA., Prakash, A., Athanas, M., Krastins, B., Rezai, T., Sutton, JN., Peterman, S., and Nicolaides, K. Mass Spectrometric Discovery and Selective Reaction Monitoring (SRM) of Putative Protein Biomarker Candidates in First Trimester Trisomy 21 Maternal Serum. J Proteome Res. 2011; 10(1):133-42. • Lopez, MF., Sarracino DA., Prakash A., Athanas M., Krastins, B., Rezai, T., Sutton JN., Peterman S., GvozdyakO., Chou S., Lo E., Buonanno F., and Ning MM. Discrimination of ischemic and hemorrhagic strokes using a multiplexed, mass spec-based assay for serum apolipoproteins coupled to multi-marker ROC algorithm. JPR (in press) • Faca, V., Pitteri, SJ., Newcomb, L., Glukhova, V., Phanstiel, D., Krasnoselsky, A., Zhang, Q., Struthers, J., Wang, H., Eng, J., Fitzgibbon, M., McIntosh, M., and Hanash, S. Contribution of Protein Fractionation to Depth of Analysis of the Serum and Plasma Proteome. Journal of Proteome Research 2007, 6, 3558-65. FIGURE 2. Pass 1 Acquisition Cycle. Method for assessing systematic errors without sample technical replicates. Systematic errors are assessed from triplicate acquisitions of standardized peptide samples. Internal standards are spiked in all samples. This approach eliminates the need for clinical sample replicates and conserves valuable specimens. All patient samples are acquired in high resolution full scan and Top-10 data dependent mode, on the Velos-Orbitrap. Biological variance and outliers are assessed with CV, PCA and other statistical methods. a. TABLE 2. Number of proteins and peptides that meet filtering criteria in Pass-1, within a clinical ROC analysis experiment. Our workflow allows for confident identification of total protein as well as unlabeled differentially expressed peptides. Initial steps in SIEVE, generate 20,000 frames (peptides). Using frame filters based upon ROC AUC or ratios, we easily identified frames that separated the patient groups. Given that our Pass 1 experiments are simultaneously collecting Top-10 data-dependent MS2 spectra, we can easily identify the abundant proteins. The unidentified frames can then be exported to an inclusion list for Pass-2 analysis. b. TABLE 1. Advantages of Two-Pass workflow over conventional discovery pipelines. (a) Throughput: At the sample preparation and mass spectrometer acquisition steps the two-pass workflow already has at maximum, a 10-fold time advantage over conventional fractionation preparations. This allows for stronger computational/statistical numbers. In comparable time frame we are able to investigate 10-times more patient samples allowing for stronger statistics. (b) Proteomic results: Equivalent number of protein IDs were obtained using the Two-Pass workflow as with classic fractionation, in significantly less time. Proteins identified covered approximately seven logs of abundance in both methods. Figure 1. Two-Pass Discovery Workflow using SIEVE and OrbitrapVelos. Given our robust LC-MS/MS methods and the power of SIEVE, we are able to identify differentially expressed proteins in unlabeled clinical samples. FIGURE 4. Frequency histogram of scheduled fragment events per minute for Pass-2 analysis (Pass-2 Inclusion List). After the given frame filter conditions [AUC>0.7 and (NRatio>1.4 or NRatio<0.6) and PRElement<1 and goodid=0], 927 frames were exported as an inclusion list for Pass-2 analysis. NOTE: These frames represent differentially expressed peptides. SEQUEST is a registered trademark of the University of Washington. All other trademarks are the property of Thermo Fisher Scientific and its subsidiaries. This information is not intended to encourage use of these products in any manners that might infringe the intellectual property rights of others.