Download
1 / 33
370 likes | 669 Vues
Surface Enhanced Raman as Tool to study Drug Protein Interactions and Nucleic Acid Detection. Chandrabhas Narayana (BHAS) Chemistry and Physics of Materials Jawaharlal Nehru Centre for Advanced Scientific Research, Jakkur P.O., Bangalore 560064, India cbhas@jncasr.ac.in

E N D
Surface Enhanced Raman as Tool to study Drug Protein Interactions and Nucleic Acid Detection ChandrabhasNarayana (BHAS) Chemistry and Physics of Materials Jawaharlal Nehru Centre for Advanced Scientific Research, Jakkur P.O., Bangalore 560064, India cbhas@jncasr.ac.in http://www.jncasr.ac.in/cbhas ICPC Nanonet Webinar from JNCASR Campus on April 14, 2011
What happens when light falls on a material? Transmission Reflection Absorption Luminescence Elastic Scattering Inelastic Scattering
Vibrations in Molecules Sym. Stretching 8086 cm-1 = 1 eV Room Temp = 25 meV HCl n = 2991 cm-1 HF n = 4139 cm-1 Sym. Bending H2O Asym. Stretching n1 = 3835 cm-1 n3 = 3939 cm-1 n2 = 1648 cm-1 Asym. Bending NH3 n1 = 3505.7 cm-1 n4 = 1689.7 cm-1 n3 = 3573.1 cm-1 n2 = 1022 cm-1 SF6 n5 = 643.35 cm-1 n2 = 615.02 cm-1 n6 = 348.08 cm-1 n3 = 947.98 cm-1 n4 = 523.56 cm-1 n1 = 774.55 cm-1
Classical Picture of Raman Induced Polarization Polarizability Taylor Expansion Stokes Raman Anti-Stokes Raman
S <eg,p2|Her|p2,eb> <eb,p2|Hep|p1,ea> <ea,p1|Her|p1,eg> |Es-Eb|x|Ei-Ea| a,b Energy diagram and Quantum picture Virtual states Raman cross section photon ex g Electronic states Vibrational states If Ei = Ea or Es =Eb We have Resonance Raman effect
Raman spectra of CCl4 Isotope effect Cl has two isotopes 35Cl and 37Cl Relative abundance is 3:1
Raman, Fluorescence and IR Absorption and emission Scattering Absorption
Problems with Raman: • Very Weak – for every 109 photons only 1 • photon Raman • Resonant Raman not feasible with every sample. • Absorption a better process than scattering
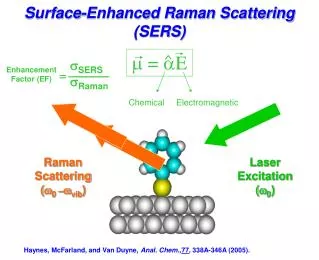
Origin of Surface Enhanced Raman Spectroscopy • Initially – thought to be depended on Surface Area of the rough surface • It was shown that the scattering cross section far exceeded the number of molecules on the rough surface. • It was proposed that the origin was due to surface plasmons – hence a truly nano phenomenon. • Alkali and Ag the best, Au and Cu the next best, Al, In, Pt followed by transition metals and then bad conductors. • Exciting wavelength, polarization, exact nature of the nanostructure also effect the SERS
Surface Enhanced Raman Scattering (SERS)Raman signal intensity gets enhanced when molecules are adsorbed on metal nanoparticles, colloids, island films etc. • Pathways for enhancement : • Electromagnetic enhancement • Enhanced local optical fields of metallic nanostructure • Chemical enhancement • Molecule-nanostructure system provide new energy states
Drug Protein Interaction studies using SERS With Tapas Kundu, JNCASR Soumik Sidhanth, Partha Kundu Pavan Kumar G V
+ H1 - H1 The Dynamic Chromatin Transcriptional inactive Transcriptional active Hizume et al, Biochemistry, 2005, 44, p12978 Kundu and Takeyasu, 2005
Factors Influencing Transcriptional Competence p300 CBP GCN5 Ash1 CARM1 PRMT1 SWI/SNF Rsc NURF HMG’s Asf1 CAF1 Spt16 NPM1 SuV39A Dot1 G9a HDAC1 HDAC4 SIRT1 NuRD HP1 MeCP2 PARP1 PC4
G.V. Pavan Kumar et al. J. Phys. Chem. B (2006) 110, 16787. Amide I SERS of p300 Tyr and/or Phe at 10 nM concentration Tyr Amide II n(COO-) Amide I A III A II b - sheet a - Helix
S.No. HAT modulator Target Reference 1 Lysyl-CoA p300 Lau et al., 2000 2 H3-CoA-20 PCAF Lau et al., 2000 Anacardic acid 3 Anacardic acid p300/PCAF/CBP Balasubramanyam et al., 2003 4 CTPB (activator) p300 Balasubramanyam et al., 2003 5 Garcinol p300/PCAF/CBP Balasubramanyam et al., 2004 6 Curcumin p300/CBP Balasubramanyam et al., 2004 7 g-butyrolactones CBP/Gcn5 Biel et al., 2004 8 Isothiazolones p300/PCAF Stimson et al., 2005 HAT modulators
C DMSO 200mM 250mM 150mM 100mM 10mM 50mM Activity CTPB CTB DMSO 150mM 200mM 250mM 100mM 50mM 10mM 150mM 200mM 250mM 100mM DMSO 150mM 200mM 250mM 100mM DMSO 50mM 10mM 50mM 10mM CH Coommassie Autoradiogram Mentalingu et al J. Phys. Chem. B 111, 4527 (2007)
Interaction studies Mentalingu et al J. Phys. Chem. B 111, 4527 (2007)
Synthetic HAT Domain of p300 Liu et al Nature 451, 846 (2008) (February 14, 2008)
B A 6j 6s CPM 6t CH 6j 6s 6t 6u 6v DMSO DMSO 6j 6s 6t 6u 6v CH Coommassie 6u Autoradiogram 6v Mentalingu et al J. Phys. Chem. B 111, 4527 (2007)
Effect of hydrophobic functional group Mentalingu et al J. Phys. Chem. B 111, 4527 (2007)
Non-PCR based detection of DNA and RNA using SERRS With Udaykumar Ranga, JNCASR Soumik Sidhanth, Gayathri K, Partha Kundu Pavan Kumar G V
HIV STRAINS HIV-1 HIV-2 M N O A B C D E J A B C D --- to --- Viral subtypes 99% (India) 13%56% (Global)
AE AG AB AGH KU HIV-1 recombinant viruses are growing at an alarmingly faster ratehttp://hiv-web.lanl.gov/content/hiv-db/CRFs/CRFs.html • In 2001 only 8 recombinants • In 2004, 16 recombinants • Today there are 34 CRFs
Strategies to detect recombinant viruses • Sequencing the whole virus • Golden standard • Universal application: useful for all the known and emerging viruses • Technically demanding • Expensive • Doesn’t lend for automation • Multi-probe hybridization assay • A real-time PCR based technique • Expensive: several TaqMan probes required • Limited application: Useful for detecting 2 or 3 subtypes • False positive results (especially in sub-optimal conditions)
Schematic Representation of HIV Viral RNA Detection 1 2 3 4 5 6 7 8 9 10 Indian Patent (2007), PCT (2007)
Template molecules (ss DNA) Viral subtype 1013 1012 1011 1010 C A B SERRS intensity Raman shift HIV-1 subtype-C capture probe detects only C, not A and B strains • Window-1 (LTR) • Subtype-C capture probe (N 730c) • Acquisition time 1 sec • Assay sensitivity approx. 102 molecules
B-virus Capture probe B C Checking for B Virus Indian Patent (2007), PCT (2007)
Gold coated magnetite nanoparticles Superparamagneticbehaviour of gold coated magnetite nanoparticles
SERS of R6G from detector probe after hybridization and washing
Conclusions • Raman provides information from the materials where all others fail. • Raman is going to strongly influence research in Biology. • Nanoparticle synthesis and plasmon tuning is going to be very important. • With the great developments in ab initio calculations and use of Gaussian, Raman would provide both physics and chemistry of the materials. Thank you for your attention!!!