Download

1 / 38
380 likes | 525 Vues
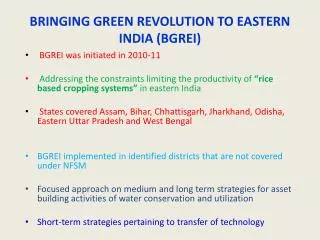
Bringing Green Revolution to Eastern States of India. A presentation by Surinder Singh, ED (Proc.), FCI Kolkata, July 26, 2012. The National Scene. Production & Procurement of Wheat at the National Level.

E N D
Bringing Green Revolution to Eastern States of India A presentation by Surinder Singh, ED (Proc.), FCI Kolkata, July 26, 2012
Production & Procurement of Wheat at the National Level The procurement as % of production has increased from 26% in 2002-03 to approx 42% in 2012-13.
Wheat Procurement in RMS 2012-13 & corresponding position in previous year Figures in Lakh MT During RMS 2012-13 (as on 25.07.12), the procurement of wheat has increased by almost 36% as compared to corresponding period of last year.
Rice Procurement (including paddy in terms of rice) in KMS 2011-12 & corresponding position in previous year (Figures in Lakh MT) We may end up procuring approx 360 LMTs of Rice, about 18 lakh tonnes more during KMS 2011-12, as compared to KMS 2010-11.
States where Rice Procurement has increased substantially in last 10 Years (Figures in Lakh MTs) Since KMS 2002-03, the procurement in Chhattisgarh, Orissa, Tamil Nadu & Bihar have increased manifold
States where Wheat Procurement has increased substantially in last 07 Years (Figures in Lakh MTs) * U.P. was in transition phase in RMS 2010-11 from DCP to Non-DCP mode. Since RMS 2006-07, the procurement in M.P., Rajasthan, Gujarat, Bihar & U.P. has increased manifold
Wheat Procurement during RMS 2012-13 Procurement Centres Operated Procurement of Wheat (In LMT, As on 25.07.12)
Paddy Procurement during KMS 2011-12 Paddy Procurement Centres Operated Procurement of Paddy (In LMT, as on 25.07.12)
Rice Procurement during KMS 2011-12 Figrs in Lakh MTs Position as on July 24,2012
Scheme of Decentralized Procurement • Introduced by GoI in 1997-98. • Under DCP Scheme, the State Govts. themselves undertake purchase of paddy & Wheat. • While the excess stocks are taken over , shortage if any, is replenished. • GoI meets the expenditure incurred by State Govt. on procurement operations.
Scheme of Decentralized Procurement (Contd..) • The State becomes self-sufficient in production and procurement • Boosts local cultivation and enhances coverage of MSP • Higher local production and procurement. • Saves huge costs towards freight • Additional revenue to the State Govt. by way of levy and taxes • Generation of direct and in-direct employment
Scheme of Decentralized Procurement (Contd…) • The State Govts. are paid advance subsidy to the extent of 100% towards MSP & Statutory taxes • For remaining incidentals such as Storage Charges, Interest and Mandi Labour Charges etc. 95% of the provisional cost is paid to the State Govt. • The remaining 5% is settled after receipt of audited accounts from the State Govt.
DCP & Non-DCP States DCP for Rice DCP for Wheat U.P. was a DCP states for Wheat & Rice from 1999-2000 till 2010-2011
Rice Procurement during KMS 2010-11 & 2011-12 (DCP & Non-DCP States) (Figures in Lakh MT) During KMS 2010-11, DCP states contributed 31% of total Rice procurement, whereas during KMS 2011-12 (as on 25.07.12), the share of DCP States has increased to 35%.
Wheat Procurement during RMS 2011-12 & 2012-13(as on 25.07.12) (Contribution by DCP & Non-DCP States) (Figures in Lakh MT) During RMS 2011-12, DCP states contributed 18% of total wheat procurement, whereas during RMS 2012-13 (as on 10.07.12), the share of DCP States has increased to 23%.
Production and Procurement of Paddy during KMS 2011-12 in Eastern States Fig. in LMT
Production and Procurement of Wheat during RMS 2012-13 in Eastern States Fig in LMT
Production vis-à-vis procurement of Paddy in Assam for last 5 yrs * Approximate
Some important reasons for poor procurement in Assam • Poor-involvement of state machineries to assist procurement operations . • Lack of Regulated market and its basic infrastructure. • No Levy order /policy declared by State Govt. • Inadequate Milling capacity and modern rice mills. • Millers are reluctant to mill paddy for low milling charges and no transport charges less than 8 Kms distance • Erratic power supply affecting milling • Non availability of adequate Storage facilities in surplus production areas • Shortage of QC manpower for procurement operations • Local law and order problems; frequent bandhs, chakka jam etc.
Wheat Rice Production vis-à-vis procurement in Bihar for last 5 Years * Estimated figures
Few issues in Procurement Operations in Bihar • Lack of Organized Mandi system • No Post Harvest operations carried out by the farmers • No competitive spot bidding. • Heavy dependence on PACS, which lacks infrastructures. • Inadequate Storage Capacity • Unavailability of high Capacity Modern rice mills. • Concentration of mills in some Pockets. • Lack of adequate QC manpower with State Agencies
Wheat Rice Production vis-à-vis procurement in West Bengal for last 5 Years * As on 25.07.12
Production vis-à-vis procurement of Rice in Orissa for last 5 Years * As on 25.07.12
Wheat Rice Production vis-à-vis procurement of Rice in Jharkhand for last 5 Years * As on 25.07.12
Few issues in procurement Operations in Jharkhand • Heavy dependence on monsoon. • Non-involvement of Multiple Agencies in procurement. • Lack of milling infrastructure • Only one month storage capacity available. • Cumbersome land acquisition acts/rules
Credit Limits taken by State Governments / Agencies for Procurement during 2011-12 * Given by State Government in their food budget, which caters to procurement requirement also. The high credit limit obtained by MP and Chhattisgarh explains their increased share in procurement in last few years.
PEG SCHEME AT A GLANCE IN WEST BENGAL (1,56,600 MT) * Silo is to be created from additional capacity for which SLC proposal is awaited.
Conclusions • There is plenty of scope for procurement in eastern states of the country • Assam, Bihar, and Jharkhand, may become DCP States, so that they become self reliant • Necessary infrastructure in terms of manpower, storage facilities, milling capacities, mandi arrangements etc. are required to be provided & even expanded • Apart from the storage capacity being created under PEG by FCI/GoI, State Governments should also endeavour to create additional storage capacity especially for intermediate storage • State Agencies may recruit adequate QC personnel, so as to ensure that procured stock meets specifications. FCI can impart basic training to such QC staff. • Multiple agencies/Cooperative Societies are required to be involved