Download
1 / 18
180 likes | 292 Vues
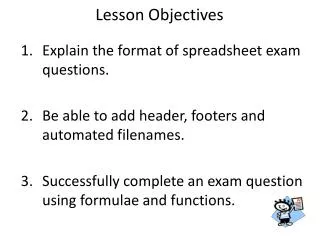
Lesson Objectives. Learn when to use the Poisson distribution. Learn how to calculate probabilities for the Poisson using the formula and the two tables in the book. Understand the inverse relationship between the Poisson and exponential. Poisson Distribution:.

E N D
Lesson Objectives • Learn when to use the Poisson distribution. • Learn how to calculate probabilitiesfor the Poisson using the formulaand the two tables in the book. • Understand the inverse relationshipbetween the Poisson and exponential.
Poisson Distribution: A data distribution used to modelthe count of the number of occurrences of some event over a specified span of time, space, or distance. Quantitative, discrete
Examples of Poisson Variables • Number of customers arriving at a store in a one-hour period. • Number of incoming calls to a 911switchboard during a one-day period • Number of potholes per mile on city streets. • Number of flaws in the next 100 sq. yd. of fabric produced at a textile mill • Number of tornados striking Alabamaper week during next spring (March, April, May).
Fixedspan of time, space, or distance. X = count of number of occurrences of event Possible values of a Poisson variable:0, 1, 2, 3, … , (whole numbers) Oneparameter: l, the average number of occurrences in the specified span of time, space, or distance Notation: X ~ Poisson( l = Mean ) Poisson Distribution
Additional Poisson Assumptions: • The number of occurrences in one interval is independent of the number in any other non-overlapping interval. • The average number of occurrences in an interval is proportional to the size of the interval. • Two or more events can’t occur at the same time or place.
Number of children in a family? Are these Poisson variables? • Number of cars passing through an intersection in 5 minutes? • Number of hits on your Web site in 24 hours? • Number of birdies in a round of golf?
The Poisson distribution: The probability that an event will occur exactly x times in a given span of time, space, or distance is:
sPoi = l is population std. dev. Parameter for the Poisson If a population of X values follows a Poisson( l ) distribution, then: • mPoi = l is population mean See formula sheet
Example: Phone calls arrive at a switchboard at an average rate of 2.0 calls per minute.If the number of calls in any time interval follows the Poisson distribution, then X = number of phone calls in a given minute. X ~ Poisson ( l = Y = number of phone calls in a given hour. Y ~ Poisson ( l = W = number of phone calls in a 15 seconds. W ~ Poisson ( l =
See page 902,Table A.3,m = 6.0, k = 5. a. Find the probability of exactly five calls in the next three minutes? Y = number of calls in next three minutes Y ~ Poisson ( l = P(Y = 5) = 7776 • .002479 = 120 =
p. 902, Table A.3,m = 6.0, k = 0, 1. p. 902, Table A.4,m = 6.0, k = 1, for P(x 1) b. Find the probability of at least two phone calls in the next three minutes? x: 0 1 2 3 4 5 6 l = 6.0 want don’t want P(x 2) = 1.0 – [P(x = 0) + P(x = 1)] 60 • e–6 1 • .002479 = .002479 P(x = 0) = = 1 0! 61 • e–6 6 • .002479 = P(x = 1) = = .014874 1 1! P(x 2) = 1.0 – [.002479 + .014874)] = .982647
Poisson Tables Table A3, page 901-904; Individual m = 4.1 P(X = 3) = _________ Table A4, page 901-904; Cumulative m = 4.1 P(X 3) = P(X=0) + P(X=1) + P(X=2) + P(X=3) = _________
Simulation: The relationship between the Poisson and Exponential distributions. Situation: The time at which a web site receives a “hit” is randomly generated over a 96 minute period. Y = the “time between hits.” Y ~ Exponential( m = 4 min./ hit)
Time Intervals Elapsed Time Y = Time Intervals Y ~ Exp( m = 4.0 min/hit) X = Count of “Hits”X ~ Poi( l = .25 hits/min.) 1.377 1.377 6.558 7.934 0.692 8.626 0.954 9.580 1.336 10.916 2.082 12.998 5.589 18.587 11.023 29.610 18.632 48.243 0.235 48.478 0.098 48.576 0.172 48.748 4.100 52.848 4.995 57.843 3.995 61.837 1.982 63.819 7.274 71.093 . . . . . . X = 25 hits Y = 3.84 min./hit sY = 4.34 min./hit X = 25 hits/ 96 min. X = .260hits/ 1 min. W = 1.042hits/ 4 min. SampleExponentialDistribution SamplePoissonDistribution 1 1 3 1 1 0 0 1 0 0 0 0 4 1 1 2 0 1 1 1 0 3 0 3
Time Intervals Elapsed Time Y = Time Intervals Y ~ Exp( m = 4.0 min/hit) X = Count of Occ.X ~ Poi( l = .25 hits/min.) 1.625 1.625 5.811 7.436 4.258 11.694 1.248 12.943 1.869 14.812 6.327 21.139 0.107 21.246 2.202 23.448 5.726 29.174 2.439 31.613 1.961 33.574 4.172 37.746 1.966 39.712 0.968 40.680 0.960 41.640 0.315 41.956 2.086 44.041 . . . . . . X = 29 hits Y = 3.12 min./hit sY = 2.56 min./hit X = 29 hits/ 96 min. X = .302hits/ 1 min. W = 1.208hits/ 4 min. SampleExponentialDistribution SamplePoissonDistribution 1 1 1 2 0 3 0 2 1 2 3 1 1 1 1 0 1 3 1 1 1 0 2 0
Time Intervals Elapsed Time Y = Time Intervals Y ~ Exp( m = 4.0 min/hit) X = Count of Occ.X ~ Poi( l = .25 hits/min.) 1.625 1.625 0.138 1.763 17.340 19.099 1.986 21.085 0.692 21.778 2.144 23.921 3.441 27.363 3.906 31.268 1.188 32.457 4.732 37.189 1.892 39.081 1.249 40.330 3.409 43.739 12.777 56.516 3.596 60.112 0.119 60.231 2.718 62.949 . . . . . . X = 25 hits Y = 3.79 min./hit sY = 4.46 min./hit X = 25 hits/ 96 min. X = .260hits/ 1 min. W = 1.042hits/ 4 min. SampleExponentialDistribution SamplePoissonDistribution 2 0 0 0 1 3 1 1 1 2 2 0 0 0 1 4 0 1 3 0 0 2 0 1
Relationship between Poisson and Exponential q If the number of “occurrences” in a fixed interval has a Poisson distribution, then the times between “occurrences” have an exponential distribution. q In symbols: X = number of arrivals ~ Poisson(l ) Y = time between arrivals ~ exponential(1/l ) The mean of the exponential is the inverse of the mean of the Poisson