Download
1 / 22
220 likes | 346 Vues
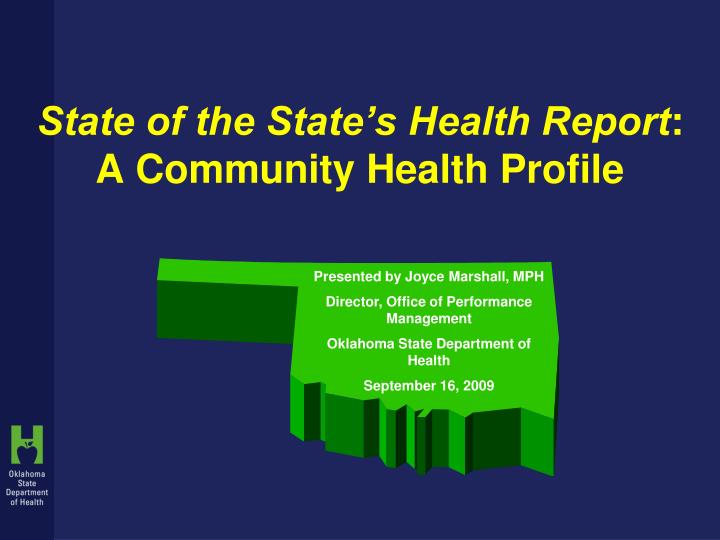
State of the State’s Health Report : A Community Health Profile. Presented by Joyce Marshall, MPH Director, Office of Performance Management Oklahoma State Department of Health September 16, 2009. Oklahoma Health Department Structure. Population Served: 3,617,316 Oklahomans

E N D
State of the State’s Health Report: A Community Health Profile Presented by Joyce Marshall, MPH Director, Office of Performance Management Oklahoma State Department of Health September 16, 2009
Oklahoma Health Department Structure Population Served: 3,617,316 Oklahomans Centralized health department system (OSDH) for state central office and 68 county health departments 2350 employees at 89 sites $356 million budget (over 50% federal) Governed by appointed Board of Health Led by Board appointed Commissioner of Health Autonomous city-county health departments in Tulsa and Oklahoma City metropolitan areas Medicaid, Mental Health & DEQ separate agencies
Performance Management Action Team [Mini-Collaborative] • Performance Management Action Team • County Performance Management Committee • SOSH Report Core Implementation Group • Team Membership • Deputy Commissioners • Chief Financial Officer • County Administrators • CHS Service Chiefs • Epidemiologists • IT Director • Director, Office of Scientific Affairs • Director, Center for Health Statistics • Director, Office of Performance Management
Oklahoma State Department of Health Strategic Map: SFY 2008 – SFY 2010 Performance Management Action Team Goals Achieve Targeted Improvements in the Health Status of Oklahomans Focus on Priorities for Improving Health Outcomes Lead Public Health Policy & Advocacy Development Strengthen Public Health System Infrastructure Increase Departmental Effectiveness and Accountability Optimize Resources and Align to Meet Key Priorities Increase Emphasis on Health Status Improvements in All Programs Define Competency Sets for the Public Health Workforce and Other Providers Strengthen Policy Development and Analysis Optimize Leadership Effectiveness Align Resources to Maximize Health Outcomes Conduct System-wide Workforce Planning and Development Target Specific Improvements in Health Disparities Assure Policies Are Evidence-Based and Data-Driven Implement Systematic Agency-wide Performance Mgmt & Other Key QI Processes Optimize Current Funding and Pursue New Opportunities Develop Accreditation Process for Health Departments Engage and Inform Policy Makers and Opinion Leaders at All Levels Target Specific Reductions in Obesity Assess & Address Department’s Physical Plant/ Infrastructure Needs Optimize Internal And External Communication Foster Appropriate Service Delivery Modalities Across Diverse Populations Target Specific Improvements in Cardiovascular Health Build Understanding of the Value of Public Health Using Social Marketing Develop and Implement Enterprise-wide IT Architecture Promote Compatible Information/Health Data Systems Across Delivery Entities Implement Continuity of Operations Planning Promote the Value of Employees to Departmental Performance Engage Public and Private Sector Partners to Leverage Effectiveness
Community Health Profile Target Area Priority Objectives for SFY 2008-2010 • Agency-wide health status indicators determined and State of the State’s Health Report format designed by end of SFY 2008. • Develop and publish new State of the State’s Health Report with overall health status indicators and county specific information by May 2009. • Update and publish State of the State’s Health Interim Report with overall health status indicators by February 2010.
State of the State’s Health Report/Profile P-D-C-A Process • Plan • Locally driven request by CHS and county administrators • Assure county buy-in from beginning • New Report Format • Determine Overall Health Status Indicators • Include Demographic/Socioeconomic Information in Report • Indicator Report Cards • County Rankings and Report Cards
State of the State’s Health Report/Profile P-D-C-A Process • Do • Vetting and Adoption of Health Status Indicators • Designed New Format for Report • Adoption of New Format by PMAT, SPT, SLT & BOH • Designed reporting system to integrate into publication design • Recruited program expertise for indicator narratives • Recruited turning point coalitions expertise for county narratives
State of the State’s Health Report/Profile P-D-C-A Process • Check • Methodology for Validity/Reliability • Flow of Report • Accuracy of Report • Design • Does it Relay Information as Needed/Desired? • Does it Promote Advocacy Usage? • Does it Assist Counties/State in Assessment & Improvement Processes?
State of the State’s Health Report/Profile P-D-C-A Process • Act • Publish Report • Distribute Report • Begin Cycle Again • Was Report Used as Desired? • Advocacy Purposes • Health Quality Improvement Purposes • Web Site Hits • Report Requests • Lessons Learned
QI Tools Used • SWOT Analysis (Level 1) • Brainstorming (Levels 1-3) • Prioritization (Levels 1-3) • Surveys (Levels 1-3) • Multi-voting (Levels 1-2) • PDCA (Levels 1-3) • Action Plans (Levels 1-3) • Sorting Tool (Levels 2-3)
Sorting Tool Indicator Criteria • Data availability (N,S,C) • Impact on health • Perceived ability to affect change • Perceived public importance/emerging issue of importance • Meaningfully measured • Links to other measures • Demographic availability • Trend data availability • Accepted as a measure of underlying/foundational characteristic
Overall Health Status Indicators • Leading Causes of Death • Common Diseases • Risk Factors & Behaviors • Socioeconomic Factors
Indicator Report Cards • & County Rankings
County Report Cards
Lessons Learned • Working Design Format • Resource Limitations • Extensive Style Guide Needed • Role Definition • Publication Limitations • Timing of Release • Information/Process Gained Will Assist Future Efforts • Still Learning!