Download
1 / 1
10 likes | 109 Vues
Frank Alsheimer and Jon Jelsema NOAA/National Weather Service Charleston, SC Dave Radell NOAA/National Weather Service Eastern Region Headquarters Bohemia, NY.

E N D
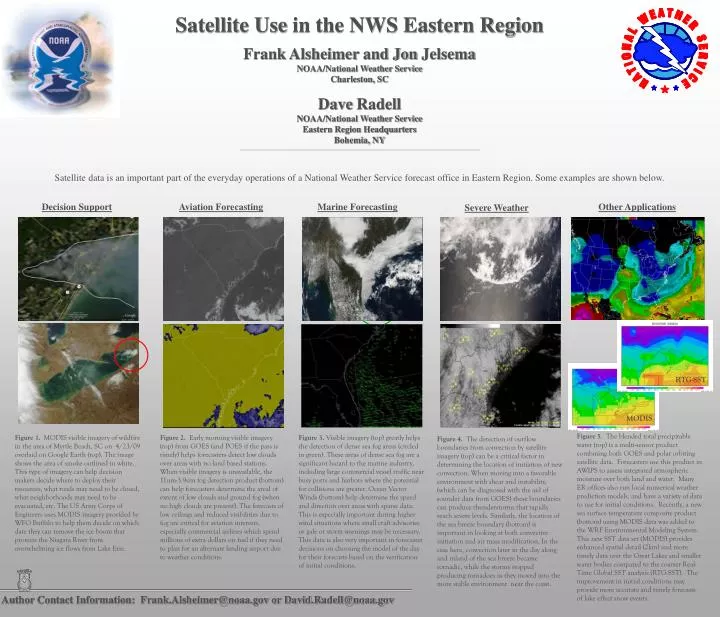
Frank Alsheimer and Jon Jelsema NOAA/National Weather Service Charleston, SC Dave Radell NOAA/National Weather Service Eastern Region Headquarters Bohemia, NY Satellite data is an important part of the everyday operations of a National Weather Service forecast office in Eastern Region. Some examples are shown below. Satellite Use in the NWS Eastern Region Decision Support Aviation Forecasting Marine Forecasting Other Applications Severe Weather RTG-SST MODIS Figure 5. The blended total precipitable water (top) is a multi-sensor product combining both GOES and polar orbiting satellite data. Forecasters use this product in AWIPS to assess integrated atmospheric moisture over both land and water. Many ER offices also run local numerical weather prediction models, and have a variety of data to use for initial conditions. Recently, a new sea surface temperature composite product (bottom) using MODIS data was added to the WRF Environmental Modeling System. This new SST data set (MODIS) provides enhanced spatial detail (2km) and more timely data over the Great Lakes and smaller water bodies compared to the coarser Real-Time Global SST analysis (RTG-SST). The improvement in initial conditions may provide more accurate and timely forecasts of lake effect snow events. Figure 1. MODIS visible imagery of wildfire in the area of Myrtle Beach, SC on 4/23/09 overlaid on Google Earth (top). The image shows the area of smoke outlined in white. This type of imagery can help decision makers decide where to deploy their resources, what roads may need to be closed, what neighborhoods may need to be evacuated, etc. The US Army Corps of Engineers uses MODIS imagery provided by WFO Buffalo to help them decide on which date they can remove the ice boom that protects the Niagara River from overwhelming ice flows from Lake Erie. Figure 2. Early morning visible imagery (top) from GOES (and POES if the pass is timely) helps forecasters detect low clouds over areas with no land based stations. When visible imagery is unavailable, the 11um-3.9um fog detection product (bottom) can help forecasters determine the areal of extent of low clouds and ground fog (when no high clouds are present). The forecasts of low ceilings and reduced visibilities due to fog are critical for aviation interests, especially commercial airlines which spend millions of extra dollars on fuel if they need to plan for an alternate landing airport due to weather conditions. Figure 3. Visible imagery (top) greatly helps the detection of dense sea fog areas (circled in green). These areas of dense sea fog are a significant hazard to the marine industry, including large commercial vessel traffic near busy ports and harbors where the potential for collisions are greater. Ocean Vector Winds (bottom) help determine the speed and direction over areas with sparse data. This is especially important during higher wind situations where small craft advisories or gale or storm warnings may be necessary. This data is also very important in forecaster decisions on choosing the model of the day for their forecasts based on the verification of initial conditions. Figure 4. The detection of outflow boundaries from convection by satellite imagery (top) can be a critical factor in determining the location of initiation of new convection. When moving into a favorable environment with shear and instability, (which can be diagnosed with the aid of sounder data from GOES) these boundaries can produce thunderstorms that rapidly reach severe levels. Similarly, the location of the sea breeze boundary (bottom) is important in looking at both convective initiation and air mass modification. In the case here, convection later in the day along and inland of the sea breeze became tornadic, while the storms stopped producing tornadoes as they moved into the more stable environment near the coast. Author Contact Information: Frank.Alsheimer@noaa.gov or David.Radell@noaa.gov