Download
1 / 76
760 likes | 792 Vues
Applied Probability and Statistics ( MATH 301 ) Lecture 1: Statistics Basic Concepts . Instructor : Assoc. Prof. Dr. Gamal M. Abdel-Hamid Email : gmabrouk@hotmail.com. Assessment System. 3 Quizzes: 30 Midterm : 30 Final Exam: 90. Textbook.

E N D
Applied Probability and Statistics(MATH 301 )Lecture 1: Statistics Basic Concepts Instructor : Assoc. Prof. Dr. Gamal M. Abdel-Hamid Email : gmabrouk@hotmail.com
Assessment System • 3 Quizzes: 30 • Midterm : 30 • Final Exam: 90
Textbook • Bluman, Allan (2004). Elementary Statistics: A step by step approach (5th ed.). McGraw-Hill. New York, NY.
Course Structure • Basic Notions of Statistics. • Descriptive Statistics: Organizing, Presenting and Summarizing Data. • Fundamentals of Probability Theory. • Inferential Statistics: Parameter Estimation, Hypothesis Testing, Non Parametric Statistics.
Statistics: Basic Concepts Lecture 1
Objectives • At the end of this lecture, we will be able to • Define what “statistics” means. • Distinguish between descriptive and inferential statistics. • Distinguish between samples and populations • Present data from frequency distributions data using graphs and diagrams.
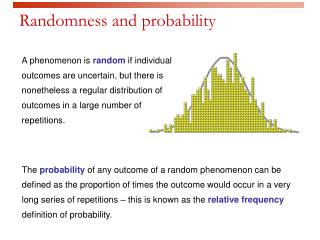
What is Statistics? Statistics is concerned with • collecting data, • describing • and analyzing them, • and possibly drawing conclusions from the data In simple terms, Statistics is the science of data
Types of statistical studies • There are different dimensions along which one may classify statistical studies. • There are two possible types of studies, depending on why the study is conducted: • Descriptive statistics • Inferential statistics.
Descriptive Statistics • Involves only the collection, organization, summarization, and presentation of data. • The point is to describe a certain situation as represented by a particular data set. • Exam statistics.
Inferential Statistics • Involves drawing conclusions from data. • The point is to make inferences about a certain situation represented by a particular data set. • From samples to populations. • Hypothesis testing. • Causes and effects.
Variables and Data • Statistical studies examine certain attributes/characteristics of a set of individuals: the population. • A variable is an attribute that may assume different values • Not at different points in time (although it typically can), but for different individuals in the population. • A data value is a value that a variable may assume. • A data set is a set of data values.
Example • Blood Type is a variable • O is a data value, A is a data value, etc… • When we collect samples of blood from some people and find their kind, we get something like {A, O, AB, B, A, O}. This is a data set.
Classification of Variables • Variables are either qualitative or quantitative. • Qualitative variables assume non-numeric values. • Gender, religion, letter grade. • Quantitative variables assume numeric values. • Discrete: number of children. • Continuous:Temperature, height.
Classification of Variables • Qualitative variables are either • Nominal: Unordered (mutually exclusive) categories. Gender, religion, phone numbers, survey responses (yes, no, undecided). • Ordinal: Ordered categories (each category names an interval on an underlying scale) Size, Rank, letters, Course grades (A, B, C, D, or F).
Classification of Variables • Quantitative variables are either • Interval: • Assume any possible value on a discrete or continuous scale • Differences can be quantified (how much more, how much less) • No natural zero. Temperature, time, Years 1000, 2000, 1776, and 1492. • Ratio: Just like interval variables, but with a natural zero number of students in a class, number of goals in a game, Prices of college textbooks.
Levels of Measurement • Nominal- categories only • Ordinal- categories with some order • Interval- differences but no natural starting point • Ratio- differences and a natural starting point
There is not complete agreement among statisticians about the classification of data into one of the four categories. For example, some researchers classify IQ data as ratio data rather than interval.
Random Sampling - selection so that each has an equalchance of being selected
Systematic Sampling - Select some starting point and then select every K th element in the population
Cluster Sampling - divide the population into sections (or clusters); randomly select some of those clusters; choose all members from selected clusters
Data Organization • Data is organized by constructing frequency distributions. • Two types of frequency distributions: • Categorical for qualitative data. • Grouped for quantitative data.
Frequency Distribution • A frequency distribution for a data set is a table listing groups into which the data are divided - classes , with a row for each class, and the number of occurrences for each class – the frequency of a class. • Sometimes the class’ relative frequency, i.e. the class frequency divided by the total number of values in the data set, is added to the table.
Relative Frequency • Relative frequency of a class is the frequency of the class divided by the total number of data. • Relative frequencies are useful for comparing distributions of different sizes. • In this case using frequencies will be misleading.
Types of Frequency Distributions • Two types of frequency distributions are normally used: • Categorical for qualitative data sets. • Grouped for large quantitative data sets.
Categorical Frequency Distributions • Example 1 The colors of twenty-five cars sold by a dealer were recorded as follows. Construct a FD.
Step 1: List the categories We have got 5 different colors in the data set: black, white, blue, green, red.
Step 2: Counting • Count the number of values from each class and place the results in the columns.
Frequency Distributions • Example 2. The following data represent the prices (in thousands LE, rounded to the nearest thousand) of 50 cars sold by a dealer. Construct a grouped frequency distribution for the data.
Problem How to group the data?
Guidelines for constructing frequency distributions • Classes must be of equal widths. • WIDTH of n-th class is given by WIDTH = Upper Limit n Lower Limit n • Classes must be mutually exclusive. • Classes must be exhaustive. • Classes must be continuous. • Number of classes should be sufficient for a clear description of the data • the book says between 5 and 20.
Step 1: Determinthe number of classes Most of the books on economics recommend the “2k”-rule: “The number of classes is the smallest integer k such that 2k > N (the number of data)”. Hence, in our example k=6 as 25 = 32 < N = 50 < 64 = 26.
Step 2: Determine the width • Find the Range of the data: Range = Highest value Lowest value • Divide the Range by the number of classes. W = Range / k and increase the number to the next integer.
Reminder: The Data Set We determine the highest and the lowest values in the data set in order to determine the width of the class in our frequency distribution.
Step 2: Determine class width (in the example) • Find the Range Range = 136 100 = 36. • Divide the range by number of classes. W = 36 / 6 = 6 7 So the width is 7.
Step 3: Determine the lower limit of the first class • The Range = 136 - 100 = 36. • We have 6 classes with a width of 7. • So the length of the 6 classes will be 6x7=42. • We leave equal gaps of (42-36):2=3 before the lowest and after the highest values. • So the lower limit of the first class is 100 – 3 = 97.
Step 4: Determine the upper limit of the first class • Upper Limit = Lower Limit + Width: • Starting with 97, Upper Limit = 97+7 = 104.
Step 5: Determine the remaining class limits Lower limit of class 2 = Upper limit of class 1, etc.
Step 6: Completing the frequency table. Count the values within each class, find the relative frequencies and fill in the table.
Step 7: Double-check Sum the frequencies to make sure that nothing was forgotten.
Example • How many classes would we have if we adopted the “square root”-rule? Construct the respective frequency distribution.
Presenting Data Graphically • We shall consider 4 types of graphs: • Histograms. • Frequency polygons. • Ogives (Cumulative frequency polygons). • Stem-and Leaf Plot • Other Graphs: Boxplots
Histograms • A histogram displays data using continuous vertical bars. • Each bar represents a class. • The height of a bar represents the frequency of a respective class. • Bars extend between class limits.
Example: Prices of cars In order to construct a histogram we need a frequency distribution