Download

1 / 41
410 likes | 443 Vues
Join us for a detailed discussion on data quality rules, statistical process control, and project goals. Learn about important concepts like variations, control charts, Pareto Principle, and interpreting control charts for a stable process. Discover how SPC and data quality intersect to ensure accurate information. Explore the use of data quality dimensions and rules in maintaining high-quality data throughout the information chain. Gain insights into inserting probes, using data quality rules, and the various classes of rules.

E N D
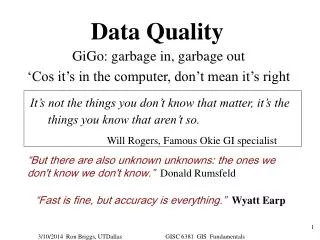
Data Quality Class 4
Goals • Discuss Project • Midterm • Statistical Process Control • Data Quality Rules
Project • Informtion is now on web site • Final version is due on July 26 • Data will be available by end of the week • We will spend some time discussing goals today
Midterm • Written exam on July 5th • Will cover: • Cost of low data quality • Dimensions of data quality • domains and mappings • SPC • Data Quality Rules
Statistical Process Control • Developed by Shewhart at Bell Labs in the 1920’s through 1950’s • Notions of Variation vs. Control • Important in original context of both equpiment manufacture and service quality
Variation • Natural variations • Defects • Errors • Mistakes • Some variations are meaningful, some are not
Causes of Variation • Common, or Chance causes • minor fluctuations or differences • not necessarily important to correct • observed to form a normal distribution • Assignable, or Special causes • (self explanatory) • We expect to see the normal variations, but assignable cause variations are interesting
Example • Measure railroad on-time performance • Trains are typically on time or a few minutes late • One night, the trains are all 1 hour late due to electrical problems – a special cause
Statistical Control • State in which variations observed can be attributed to common causes that do not change with time
Pareto Principle • In a population that contributes to a common effect, relaively few of the contributors account for the bulk of the effect • Example: code performance analysis • Can be used to direct analysis
Control Chart 2 • Used to look for distinct variations from the mean • Goal: predictable behavior • Plot series of data over time • Variations are represented as distance from the mean
Control Chart 3 • Center Line: can be computed as mean of variable points • Upper Contril Limit: three standard deviations above center line • Lower Control Limit: three standard deviations below center line
Control Chart 4 • As long as all points are between UCL and LCL, the variations are due to common causes, and the process is said to be in control, or stable • Points above UCL or below LCL are indicative of abnormal variation, and are due to special causes – the process is not in control
Control Chart 5 • Select variables chart or attributes chart • Use data quality dimensions as guideline • Select meaningful variables to measure (i.e., stuff that will point at a diagnosible problem)
Interpreting the Control Chart • Lack of stability indicates potential problem • Look for: • points utside of control limits • zone testing (clusters of points within certain standard deviation limits) • potential to split out data points into different logical data sets • Look for cycles
SPC and Data Quality • “The Information Factory” • Use data quality dimensions as guideline for investigation • Analyze the state of data as it passes through the information chain • Probing can be automated with data quality rules
Inserting the Probes • FInd a location in information chain that is: • nondisruptive • easy to access • easy to retool
Data Quality Rules • Definitions • Proscriptive Assertions • Prescriptive Assertions • Conditional Assertions • Operational Assertions
Definitions • Nulls • Domains • Mappings
Proscriptive Assertions • Describe what is not allowed • Used to figure out what is wrong with data • Used for validation
Prescriptive Assertions • Describe what is supposed to happen with data • Can be used for data population, extraction, transformation • Can also be used for validation
Conditional Assertions • Define an assertion that must be true if a condition is true
Operational Assertions • Define an action that must be taken if a condition is true
9 Classes of Rules • 1) Null value rules • 2) Value rules • 3) Domain membership rules • 4) Domain Mappings • 5) Relation rules • 6) Table, Cross-table, and Cross-message assertions • 7) In-Process directives • 8) Operational Directives • 9) Other rules
Null Value Rules • Null value specification • Define GETDATE for unavailable as “fill in date” • Null values allowed • Attribute A allowed nulls {GETDATE, U, X} • Null values not allowed • Attribute B nulls not allowed
Value Rules • Value restriction rule Restrict GRADE: value >= ‘A’ AND value <= ‘F’ AND value != ‘E’
Domain Rules • Domain Definition • Domain Membership • Domain Nonmembership • Domain Assignment
Mapping Rules • Mapping definition • Mapping membership • Mapping nonmembership
Relation Rules • Completeness • Exemption • Consistency • Derivation
Completeness • Defines when a record is complete (I.e., what fields must be present) IF (Orders.Total > 0.0), Complete With {Orders.Billing_Street, Orders.Billing_City, Orders.Billing_State, Orders.Billing_ZIP}
Exemption Defines which fields may be missing IF (Orders.Item_Class != “CLOTHING”) Exempt {Orders.Color, Orders.Size }
Consistency • Define a relationship between attributes based on field content • IF (Employees.title == “Staff Member”) Then (Employees.Salary >= 20000 AND Employees.Salary < 30000)
Derivation • Prescriptive form of consistency rule • Details how one attribute’s value is determined based on other attributes IF (Orders.NumberOrdered > 0) Then { Orders.Total = (Orders.NumberOrdered * Orders.Price) * 1.05 }
Table and Cross-Table Rules • Functional Dependence • Primary Key Assertion • Foreign Key Assertion (=referential integrity)
Functional Dependence • Functional Dependence between columns X and Y: • For any two records R1 and R2 in a table, • if field X of record R1 contains value x and field X of record R2 contains the same value x, then if field Y of record R1 contains the value y, then field Y of record R2 must contain the value y. • In other words, attribute Y is said to be determined by attribute X.
Primary Key Assertion • A set of attributes defined as a primary key must uniquely identify a record • Enforcement = testing for duplicates across defined key set
Foreign Key Assertion • When the values in field f in table T is chosen from the key values in field gin table S, field S.g is said to be a foreign key for field T.f • If f is a foreign key, the key must exist in table S, column g (=referential integrity)
In-process Directives • Definition directives (labeling information chain members) • Measurement directives • Trigger directives
Operational Directives • Transformation • Update
Other Rules • Approximate Searching rules • Approximate Matching rules