Download
1 / 15
150 likes | 156 Vues
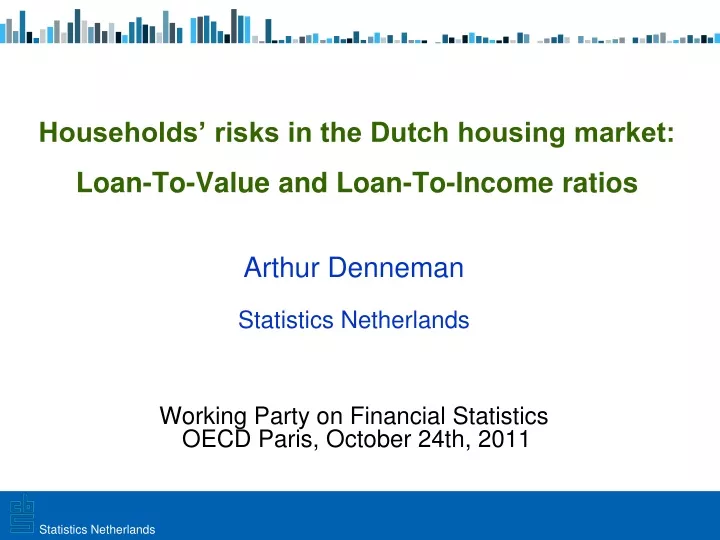
Statistics Netherlands. Haarlem, 10 maart 2009. Households’ risks in the Dutch housing market: Loan-To-Value and Loan-To-Income ratios. Arthur Denneman Statistics Netherlands Working Party on Financial Statistics OECD Paris, October 24th, 2011. Utrecht, 20 februari 2009.

E N D
Statistics Netherlands Haarlem, 10 maart 2009 Households’ risks in the Dutch housing market:Loan-To-Value and Loan-To-Income ratios Arthur DennemanStatistics Netherlands Working Party on Financial StatisticsOECD Paris, October 24th, 2011 Utrecht, 20 februari 2009
Statistics Netherlands Haarlem, 10 maart 2009 Outline Loan-To-Value (LTV) and Loan-To-Income (LTI) Macro approach Data sources Subpopulations LTV and LTI results Overview of some highlights (see paper for all results) Concluding remarks Micro approach: risk tables as new tool Utrecht, 20 februari 2009
Statistics Netherlands Haarlem, 10 maart 2009 LTV and LTI: macro approach Macro approach, (sub)population considered as ‘one entity’ Loan = total home mortgage of main residences Value = total house value of main residences Income = total disposable income In the Netherlands 7 million private households I 4 million owner-occupiers in NL II 85% of owner-occupiers with home mortgage Household characteristics many subpopulations of target populations I and II Utrecht, 20 februari 2009
Statistics Netherlands Haarlem, 10 maart 2009 LTV and LTI: data sources Ministry of Finance / Tax authorities: all tax payers (7 million) Home mortgage interest deduction from taxable incomeincome is increased by percentage of house value long term saving plans in parallel of home mortgage Income panel survey: 85 thousand private households not only disposable income, also gross income etc. Utrecht, 20 februari 2009
Statistics Netherlands Haarlem, 10 maart 2009 LTV and LTI: subpopulations - Age and origin of main breadwinner - Size of household and household composition - Number of persons with income in a household - Main source of household income - Income, house value, and equity categories (25% groups) - Dwelling location: region and degree of urbanisation Utrecht, 20 februari 2009
Statistics Netherlands Haarlem, 10 maart 2009 Loan-To-Value The Netherlands, 2005-2009 Loan-To-Income Utrecht, 20 februari 2009
Statistics Netherlands Haarlem, 10 maart 2009 Age of main breadwinner, 2009, all owner-occupiers Age ↑ Mortgage ↓ (monthly payments) House Value ↑ (upward house prices) Income ↑ (getting promotion / a rise) Utrecht, 20 februari 2009
Statistics Netherlands Haarlem, 10 maart 2009 Origin of main breadwinner, 2009, all owner-occupiers When did they become citizen of the Netherlands?Indonesia ±1950, Suriname ±1975, and Turkey starting from ±1970. Utrecht, 20 februari 2009
Statistics Netherlands Haarlem, 10 maart 2009 Degree of urbanisation, 2009, all owner-occupiers Utrecht, 20 februari 2009
Statistics Netherlands Haarlem, 10 maart 2009 Loan-To-Value 2009 all owner-occupiers Loan-To-Income Utrecht, 20 februari 2009
Statistics Netherlands Haarlem, 10 maart 2009 Concluding remarks Dissemination at website of Statistics Netherlands: - LTV and LTI for ± 100 (!) subpopulations annual data, starting from 2005 includes all kinds of reference data first release, hopefully, at end of this year - LTI: not only disposable income, also gross income - not only macro approach, also ‘micro’ variables like median, 25% percentile, and 75% percentile - new tool to interpret data: risk tables Utrecht, 20 februari 2009
Statistics Netherlands Haarlem, 10 maart 2009 Risk table, all owner occupiers Utrecht, 20 februari 2009
Statistics Netherlands Haarlem, 10 maart 2009 Risk table, all owner occupiers Utrecht, 20 februari 2009
Statistics Netherlands Haarlem, 10 maart 2009 Risk table, all owner occupiers Utrecht, 20 februari 2009
Statistics Netherlands Haarlem, 10 maart 2009 QUESTIONS ??? Utrecht, 20 februari 2009