Download
1 / 32
320 likes | 451 Vues
ANOVA An alysis o f Va riance. Most Useful when Conducting Experiments. ANOVA. The test you choose depends on level of measurement: Independent Dependent Statistical Test Dichotomous Interval-ratio Independent Samples t-test Dichotomous Nominal Nominal Cross Tabs

E N D
ANOVAAnalysis of Variance Most Useful when Conducting Experiments
ANOVA The test you choose depends on level of measurement: Independent Dependent Statistical Test Dichotomous Interval-ratio Independent Samples t-test Dichotomous Nominal Nominal Cross Tabs Dichotomous Dichotomous Nominal Interval-ratio ANOVA Dichotomous Dichotomous Interval-ratio Interval-ratio Correlation and OLS Regression Dichotomous
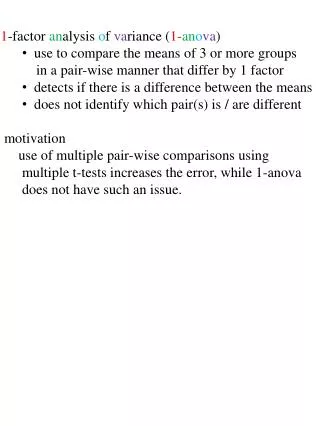
ANOVA • Sometimes we want to know whether the mean level on one continuous variable (such as income) is different for each group relative to the others in a nominal variable (such as degree received). • We could use descriptive statistics (the mean income) to compare the groups (sociology BA vs. MA vs. PhD). • However, as sociologists, we usually want to use a sample to determine whether groups are different in the population.
ANOVA • ANOVA is an inferential statistics technique that allows you to compare the mean level on one interval-ratio variable (such as income) for each group relative to the others in a nominal variable (such as degree). • If you had only two groups to compare, ANOVA would give the same answer as an independent samples t-test.
ANOVA • One typically uses ANOVA in experiments because these typically involve comparing persons in experimental conditions with those in control conditions to see if the experimental conditions affect people. Independent Dependent Nominal Variable Interval-ratio Variable Experimental Grouping Outcome Variable • For example: Is “Diff’rent Strokes” funnier than ”Charles in Charge?” Experiment: Do kids exposed to “Diff’rent Strokes” laugh more than those who watch “Charles in Charge?” Expose Groups to a Show Record Amount of Laughter • We then use the sample to make inferences about the population.
ANOVA What if three racial groups had incomes distributed like this in your sample? All Groups Groups Broken Down Isn’t it conceivable that the differences are due to natural random variability between samples? Would you want to claim they are different in the population? Income in $Ks Income in $Ks
ANOVA Now…What if three racial groups had incomes distributed like this in your sample? All Groups Combined Groups Separated Out Doesn’t it now appear that the groups may be different regardless of sampling variability? Would you feel comfortable claiming the groups are different in the population? Income in $Ks Income in $Ks
ANOVA • Conceptually, ANOVA compares the variance within groups to the overall variance between all the groups to determine whether the groups appear distinct from each other or if they look quite the same. Categories of Nominal Variable Measures on Continuous Variable 3 4 5 6 7 8 9 10 11 12 13 14 15 16 17 18 19 Y-bar Y-bar Y-bar 10 11 12 13 14 15 16 Y-bars Different groups, different means. Similar groups, similar means.
ANOVA • When the groups have little variation within themselves, but large variation between them, it would appear that they are distinct and that their means are different. Y-bar Y-bar Y-bar Y-bars Different groups, different means. Similar groups, similar means.
ANOVA • When the groups have a lot of variation within themselves, but little variation between them, it would appear that they are similar and that their means are not really different (perhaps they differ only because of peculiarities of the particular sample). Y-bar Y-bar Y-bar Y-bars Different groups, different means. Similar groups, similar means.
ANOVA • Let’s call the the between groups variation: Between Variance: Between Sum of Squares, BSS/df • Let’s call the within groups variation: Within Variance: Within Sum of Squares, WSS/df • ANOVA compares Between Variance to Within Variance through a ratio we will call F. F = BSS/g-1 WSS/n-g Y-bar Y-bar Y-bar
ANOVA • So what are these BSS and WSS things? • Remember our friend “Variance?” • What we are doing is separating out our dependent variable’s overall variance for all groups into that which is attributable to the deviations of groups’ means from the overall mean (B) and deviations of individuals’ scores from their own group’s mean (W).
ANOVA Variance: Deviation Yi – Y-bar Squared Deviation (Yi – Y-bar)2 Sum of Squares Σ(Yi – Y-bar)2 Variance Σ(Yi – Y-bar)2 n – 1 (Standard Deviation) Σ(Yi – Y-bar)2 n – 1
Between Variance Deviation : Y-barg– Y-barbig Squared Deviation: (Y-barg– Y-barbig)2 Weight by number of people in each group: ng *(Y-barg– Y-barbig)2 Sum of Squares: Σ (ng *(Y-barg– Y-barbig)2) Variance: Σ (ng *(Y-barg– Y-barbig)2) g – 1 … or BSS/g-1 Within Variance Deviation : Yi – Y-barg Squared Deviation: (Yi – Y-barg)2 Sum of Squares: Σ (Σ(Yi – Y-barg)2) Variance: Σ (Σ(Yi – Y-barg)2) n – g … or WSS/n-g ANOVASeparating VarianceTake your continuous variable and separate scores into groups according to your nominal variable Y-barg = Each Group’s Mean Y-barbig= Overall Mean g = # of Groups ng = # of Cases in Each Group Yi = Each Data Point in a Group n = # of Cases in Overall Sample
ANOVA F = BSS/g-1 WSS/n-g As WSS gets larger, F gets smaller. As WSS gets smaller, F gets larger. So, as F gets smaller, the groups are less distinct. As F gets larger, the groups are more distinct. Y-bar Y-bar Y-bar Y-bar Y-bar Y-bar
ANOVA • In repeated sampling, if there were no group differences, that ratio “F” would be distributed in a particular way. Distribution of “F” over repeated sampling, recording a new F every time.
ANOVA • The F distribution is like the normal curve, t distribution, and chi-squared distribution: we know that there is a critical F that demarcates the value beyond which the values of the rarest 5% of F’s will fall. Critical F Most extreme 5% of F’s What if your sample’s F were this large?
ANOVA • One other thing to note is that, like chi-squared, there are different F distributions depending on the degrees of freedom (df) of the BSS and the WSS. E.g., F(g-1, n-g). • BSS df: # of groups in your nominal variable minus 1 • WSS df: # of cases in sample minus number of groups Critical F Most extreme 5% of F’s
ANOVA Look what I found on the web. F distribution changes shape depending on your sample size and the number of groups you are comparing:
ANOVA Null: Group means are equal; 1 = 2 = …= g Alternative: At least one group’s mean is different So… if F is larger than the critical F: Reject the Null in favor of the alternative!
ANOVA • If your F is in the most extreme 5% of F’s that could occur by chance if your two variables were unrelated, you have good evidence that your F might not have come from a population where the means for each group are equal. • So, essentially, ANOVA uses your sample to tell you whether, in the population, you have overlapping group distributions (no difference between means) or fairly distinct group distributions (differences between means).
ANOVA Conducting a Test of Significance for the Difference between Two or More Groups’ Means—ANOVA By using what we know about the F-ratio, we can tell if our sample could have come from a population where groups’ means are equal. • Set -level (e.g., .05) • Find Critical F (depends on BSS and WSS df and -level) • State the null and alternative hypotheses: Ho: 1 = 2 = . . . = n Ha: At least one group’s mean does not equal the others’ • Collect and Analyze Data • Calculate F: F = BSS/ g – 1 = Σ (ng * (Y-barg– Y-barbig)2)/g-1 WSS/ n – g Σ(Σ(Yi – Y-barg)2)/n-g • Make decision about the null hypothesis (is F > Fcrit?) • Find P-value
ANOVA An Example: A sociologist wants to know which among a set of HIV education programs is more effective at reducing risky sexual behavior. These include 1) Abstinence Promotion, 2) Promotion of Condoms, 3) Sex Education, or 4) 1 – 3 Combined. She will collect data from 300 high school students and collect data on self-reports of risky sexual behavior six months later.
ANOVA Four Conditions with 300 Students: By using what we know about the F-ratio, we can tell if our sample could have come from a population where groups’ means are equal. • Set -level: .05 • Find Critical F: Fcrit(3, 296) = 2.6 • State the null and alternative hypotheses: Ho: 1 = 2 = 3 = 4 Ha: At least one group’s mean does not equal the others’ • Collect Data: Abstinence Condoms Sex Ed All 3 Total n: 125 75 50 50 300 Y-bar: 1.3 1.5 1.4 1.1 1.33 s: 0.40 0.42 0.45 0.38 (BTW: These are fake data.) • Calculate F: F = BSS/ g – 1 = Σ (ng * (Y-barg– Y-barbig)2)/g-1 WSS/ n – g Σ(Σ(Yi – Y-barg)2)/n-g • Make decision about the null hypothesis • Find P-value
ANOVA 4. Collect Data: Abstinence Condoms Sex Ed All 3 Total n: 125 75 50 50 300 Y-bar: 1.3 1.5 1.4 1.1 1.33 s: 0.40 0.42 0.45 0.38 5. Calculate F: F = BSS/ g – 1 = Σ (ng * (Y-barg– Y-barbig)2)/g-1 WSS/ n – g Σ(Σ(Yi – Y-barg)2)/n-g BSS = 125(1.3 – 1.33)2 + 75(1.5 – 1.33)2 + 50(1.4 – 1.33)2 + 50(1.1 – 1.33)2 = .1125 + 2.168 + .245 + 2.645 = 5.171 WSS = Hmmm… WSS has to be “uncovered” by using the formula for s to find the SS (in numerator of within variance) for each group. Σ(Yi – Y-barg)2 = SSg sg = (Yi – Y-barg)2/n-1 sg = SSg/n-1 sg2 = SSg/n-1 (n-1)sg2 = SSg SS1= (125 – 1)*(.40)2 = 19.84 SS3= (50 – 1)*(.45)2 = 9.923 SS2= (75 – 1)*(.42)2 = 13.05 SS4= (50 – 1)*(.38)2 = 7.076 WSS = SS1 + SS2 + SS3 + SS4 WSS = 19.84 + 13.05 + 9.923 + 7.076 = 49.89 BSS/g-1 = 5.171/3 = 1.724 F = 1.724 / 0.1685 = 10.23 WSS/n-g = 49.89/296 = 0.1685
ANOVA 5. Calculate F: F = BSS/ g – 1 = Σ (ng (Y-barg– Y-barbig)2)/g-1 WSS/ n – g Σ(Σ(Yi – Y-barg)2)/n-g BSS = 125(1.3 – 1.33)2 + 75(1.5 – 1.33)2 + 50(1.4 – 1.33)2 + 50(1.1 – 1.33)2 = .1125 + 2.168 + .245 + 2.645 = 5.171 WSS = Hmmm… WSS has to be “uncovered” by using the formula for s.d. to find the SS (in numerator of variance) for each group. s.d.g = (Yi – Y-barg)2/n-1 s.d. g = SSg/n-1 s.d. g2 = SSg/n-1 (n-1)s.d. g2 = SSg SS1= (125 – 1)*(.40)2 = 19.84 SS3= (50 – 1)*(.45)2 = 9.923 SS2= (75 – 1)*(.42)2 = 13.05 SS4= (50 – 1)*(.38)2 = 7.076 WSS = 19.84 + 13.05 + 9.923 + 7.076 = 49.89 BSS/g-1 = 5.171/3 = 1.724 F = 1.724 / 0.1685 = 10.23 WSS/n-g = 49.89/296 = 0.1685 6. Make decision about the null hypothesis: 10.23 > 2.6 (Fcrit); so reject the null 7. Find P-value: P < .001 We have a very low chance (almost 0%) that we got our sample from a population whose group means are all equal
ANOVA Question: We know that at least one mean is different from another. We don’t know which one. Now what? Answer: We do a post-hoc test to see which means are different from each other. A post-hoc test (“after the fact test”) is a series of independent samples t-tests comparing each group’s mean to each of the others’ means.
ANOVA Conducting the t-tests, you will have g(g-1)/2 pairs of t-tests. In our example, we will have 4 (4-1)/2 or 6 comparisons. But before you go off doing all these t-tests, remember that with statistics we play the odds. In a series of t-tests, just by chance you are likely to encounter type 1 errors where you falsely reject a true null. How many true nulls would be rejected in a series of 100 t-tests whose -levels were .05? Answer: 5
ANOVA Because of the likelihood of multiple comparison errors, statisticians have created ways to reduce the multiple comparison error rate. One of these is the Bonferroni, which adjusts the -level for each comparison by the number of comparisons. This lowers the likelihood of rejection in each test, making the joint -level equal to the original -level. In our example, .05/6 = .008. So -level for each comparison becomes .008. The combined likelihood of a type 1 error will be .05.
ANOVA In our example, the critical t is 2.41 for -level =.008. t = (Y-bargb – Y-barga)/ s.e.; s.e. = wss/n-g * 1/ngb + 1/nga When I calculate the t-scores, I get that each group is significantly different from all others: “All 3” is most effective, followed by abstinence, then sex ed, then condoms Therefore, we have evidence suggesting that teaching all three methods works best, while just focusing on condoms is worst in terms of preventing risky sexual behavior. Abstinence Condoms Sex Ed All 3 Total n: 125 75 50 50 300 Y-bar: 1.3 1.5 1.4 1.1 1.33
ANOVA Something to look up in the future: There are other post-hoc tests out there. For Example: Scheffe’s Test Tukey Test These will often allow you to not only compare each group to the others one at a time, but they will also allow you to combine groups to test each group against the combination of the others. In our example, we might want to collapse abstinence, condoms, and sex ed into one group of 250 to compare against the “all 3 methods” group of 50.
ANOVA • Now let’s do an example using SPSS. • We’ll explore whether Race affects education. Race Education Null: White Mean = Black Mean = Others Mean Alternative: At least one race’s mean is different.