Download
1 / 33
330 likes | 504 Vues
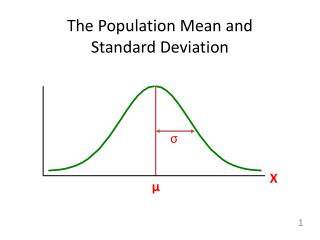
Creating Synthetic Microdata for Higher Educational Use in Japan : Reproduction of Distribution Type based on the Descriptive Statistics. Kiyomi Shirakawa Hitotsubashi University / National Statistics Center Yutaka Abe Hitotsubashi University Shinsuke Ito Chuo University. Outline.

E N D
Creating Synthetic Microdata forHigher Educational Use in Japan: Reproduction of Distribution Type based on the Descriptive Statistics Kiyomi Shirakawa Hitotsubashi University / National Statistics Center YutakaAbe Hitotsubashi University Shinsuke Ito Chuo University
Outline 1. Synthetic Microdata in Japan 2. Problems with Existing SyntheticMicrodata 3. Correcting Existing Synthetic Microdata 4. Creating New Synthetic Microdata 5.SensitivityRulesfor New Synthetic Microdata 6. Comparison between Various Sets of Synthetic Microdata 7. Conclusions and Future Outlook
1. Synthetic Microdata in Japan Synthetic Microdata for educational use are available in Japan: • Generated using multidimensional statistical tables. • Based on themethodology of microaggregation (Ito (2008), Ito and Takano (2011), Makita et al (2013)) • Created based on the original microdata from the 2004 ‘National Survey of Family Income and Expenditure’ • Synthetic microdata are not original microdata.
Legal Framework New Statistics Act in Japan(April 2009) • Enables the provision of Anonymized microdata (Article 36) and tailor-made tabulations (Article 34). • Allows a wider use of official microdata. • Allows use of official statistics in higher education and academic research. • However, permission process is required. To provide an alternative to Anonymized microdata, the NSTAC has developed Synthetic microdata that can be accessed withoutapermission process.
Image of Frequency of Originaland Synthetic Microdata Source: Makita et al. (2013).
2. Problems with Existing Synthetic Microdata (1) All variables are subjected to exponential transformation in units of cells in the result table. Too large
(2) Correlation coefficients (numerical) between all variables are reproduced. In the below table, several correlation coefficients are too small. The reason is that correlation coefficients between uncorrelated variables are also reproduced. Too small Top half: original data; bottom half: synthetic microdata
(3) Qualitative attributes of groups having a frequency (size) of 1 or 2 are transformed to "Unknown" (V) or deleted. The information loss when using this method is too large. Furthermore, the variations within the groups are too large to merge qualitative attributes between different groups. Note: "V" stands for "unknown". Source: Makita et al. (2013). Figure 1: Processing records with common values for qualitative attributes into groups with a minimum size of 3.
A Kind of Synthetic microdata in Japan frequency, mean, standard deviation frequency, mean, SD correlation coefficient, skewness, kurtosis reproduce original dist. type not consider original dist. type
Information • Shortly, the National Statistics center will be delivering new Public Use File in the National Survey of Family Income and Expenditure 2009. • However, there isn't a plan that creating an 'Academic Use File'. • Therefore, in this paper, we will be suggestion of a creating its file.
3. Correcting Existing Synthetic Microdata The following approaches can be used to correct the existing Synthetic microdata. • Select the transformation method (logarithmic transformation, exponential transformation, square-root transformation, reciprocal transformation) based on the original distribution type (normal, bimodal, uniform, etc.). • Detect non-correlations for each variable. • Merge qualitative attributes in groups with a size of 1 or 2 into a group that has a minimum size of 3 in the upper hierarchical level.
Box-Cox Transformation λ = 0 logarithmic transformation λ = 0.5 square-root transformation λ = -1 reciprocal transformation λ = 1 linear transformation
4. Creating New Synthetic Microdata In order to improve problems with existing Synthetic microdata, new synthetic microdata were created based on the following approaches. (1) Create microdata based on kurtosis and skewness (2) Create microdata based on the two tabulation tables of the basic table and details table (3) Create microdata based on multivariate normal random numbers and exponential transformation This process allows creating synthetic microdata with characteristics similar to those of theoriginal microdata. Itiscalled‘AcademicUseFile'.
(1) Microdata createdbased on Kurtosis and Skewness Differences of kurtosis and skewness Original microdata and transformed indicators for each transformation
(2) Microdata created based on two Tabulation Tables (Basic Table and Details Table) Basic Table (matches with original mean and standard deviation, approximate correlation coefficients for each variable) Details Table (means and standard deviations for creating synthetic microdata for multidimensional cross fields)
(3) Microdata created based on Multivariate Normal Random Numbers and Exponential Transformation λ in the Box-Cox transformation is required in order to change the distribution type of the original data into a standard distribution. Based on λ in the Box-Cox transformation However, approximately using exponential transformation a random number that approximates the kurtosis and skewness of the original microdata was selected.
5. Sensitivity Rules for Academic Use File * Reference 1 A Network of Excellence in the European Statistical System in the field of Statistical Disclosure Control (ESSNet SDC) NSTAC Working Paper, No.10
Combination when N=20(trial) • requirement of combination assuming each variable is integer: +…… + …… • Range of each variable N-th maximum and minimum value • Number of Combinations: 97,132,873 patterns Is AUF safe or unsafe?
unsafe combinations by p% rule ( freq. N=20) only 8,849 sets in 97,132,873sets(0.01%)
Maximum number of combinations grouping freq. N=20 combinations by each statistic
Range of each statistic grouping by SD, Skewness and Kurtosis (freq. N=20)
6.Comparison between Various Sets of Synthetic Microdata Comparison of original microdata and each set of synthetic microdata
The most useful microdata from the indicators in the below table are in column number 2. Note that for reference, column number 4 is the same as the trial synthetic microdata method.
Scatter plots of living expenditure and food for each microdata Food Hierarchization, and kurtosis, skewness and λ of Box-Cox transformation Multivariate lognormal random numbers Kurtosis and skewness living expenditure
Example Result Table for Academic Use File A: 5-year age groups; B: employment/unemployed; C: company classification; D: company size; E: industry code; F: occupation code
7. Conclusions and Future Outlook Conclusions We suggested improvements to synthetic microdata created by the National Statistics Center for statistics education and training. We created new synthetic microdata using several methods that adhere to this disclosure limitation method. The results show that kurtosis, skewness, and Box-Cox transformation λ are useful for creating synthetic microdata in addition to frequency, mean, standard deviation, and correlation coefficient which have previously been used as indicators. Next Steps Decide the number of cross fields (dimensionality) of the basic table and details table and the style (indicators to tabulate) of the result table according to the statistical fields in the public survey. Expand this work to the creation and improvement of synthetic microdata from other surveys.
References Anscombe, F.J.(1973), "Graphs in Statistical Analysis," American Statistician, 17-21. Bethlehem, J. G., Keller, W. J. and Pannekoek, J.(1990) “Disclosure Control of Microdata”, Journal of the American Statistical Association, Vol. 85, No. 409 pp.38-45. Defays, D. and Anwar, M.N.(1998) “Masking Microdata Using Micro-Aggregation”, Journal of Official Statistics, Vol.14, No.4, pp.449-461. Domingo-Ferrer, J. and Mateo-Sanz, J. M.(2002) ”Practical Data-oriented Microaggregation for Statistical Disclosure Control”, IEEE Transactions on Knowledge and Data Engineering, vol.14, no.1, pp.189-201. Höhne(2003) “SAFE- A Method for Statistical Disclosure Limitation of Microdata”, Paper presented at Joint ECE/Eurostat Work Session on Statistical Data Confidentiality, Luxembourg, pp.1-3. Ito, S., Isobe, S., Akiyama, H.(2008) “A Study on Effectiveness of Microaggregation as Disclosure Avoidance Methods: Based on National Survey of Family Income and Expenditure”, NSTAC Working Paper, No.10, pp.33-66 (in Japanese). Ito, S.(2009) “On Microaggregation as Disclosure Avoidance Methods”, Journal of Economics, Kumamoto Gakuen University, Vol.15, No.3・4, pp.197-232 (in Japanese) Makita, N., Ito, S., Horikawa, A., Goto, T., Yamaguchi, K. (2013) “Development of Synthetic Microdata for Educational Use in Japan”, Paper Presented at 2013 Joint IASE / IAOS Satellite Conference, Macau Tower, Macau, China, pp.1-9.
Creating the Academic Use File Synthetic Microdata based on frequency, SD, skewness and kurtosis Original Data tabular items: frequency, SD, skewness, kurtosis tables tabulation individual data Making Academic Use File Combination by freq. DB freq., SD, skewness, kurtosis extract candi-date data decide combi. of data GRG non-linear extract narrow collate SD and skew. is the same, kurtosis is approximate using MS-EXCEL Solver because each value is integer, extract by each statistic approximation store all of combination by frequency transform total to 100
Rules for output checking Brandt, M., Franconi, L., Guerke, C., Hundepool, A., Lucarelli, M., Mol, J., Ritchie, F., Seri, G. and Welpton, R. (2010) Guidelines for the checking of output based on microdata research. Project Report. ESSnet SDC.