Download
1 / 11
110 likes | 124 Vues
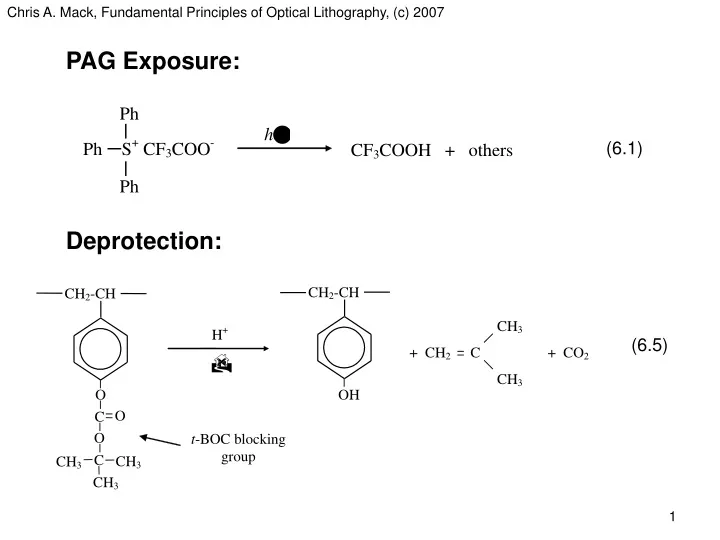
PAG Exposure:. (6.1). Deprotection:. (6.5). Figure 6.1. Examples of 248-nm blocking groups: the high activation t-butyl ester; and the low activation acetal. Figure 6.2. The 1D reaction diffusion point spread function ( RDPSF ) and its component terms. (a). (b).

E N D
Chris A. Mack, Fundamental Principles of Optical Lithography, (c) 2007 PAG Exposure: (6.1) Deprotection: (6.5)
Chris A. Mack, Fundamental Principles of Optical Lithography, (c) 2007 Figure 6.1. Examples of 248-nm blocking groups: the high activation t-butyl ester; and the low activation acetal.
Chris A. Mack, Fundamental Principles of Optical Lithography, (c) 2007 Figure 6.2. The 1D reactiondiffusion point spread function (RDPSF) and its component terms.
Chris A. Mack, Fundamental Principles of Optical Lithography, (c) 2007 (a) (b) Figure 6.3. Atmospheric base contamination leads to T-top formation. Shown are line/space features printed in APEX-E for: (a) 0.275 mm features with no delay; and (b) 0.325 mm features with 10 minute delay between exposure and post-exposure bake (courtesy of SEMATECH).
Chris A. Mack, Fundamental Principles of Optical Lithography, (c) 2007 (a) (b) Figure 6.4. The effect of quencher (Q) on the acid latent image H(x): (a) after exposure but before the quenching reaction; and (b) after the quenching reaction (assuming Kquench » Kamp).
Chris A. Mack, Fundamental Principles of Optical Lithography, (c) 2007 Figure 6.5. The effect of quencher on the shape of the latent image. Both resists have identical processing, except that the dose for each is adjusted to be the dose to size (130 nm lines and spaces).
Chris A. Mack, Fundamental Principles of Optical Lithography, (c) 2007 Figure 6.6. An Arrhenius plot (log of the rate constant versus the inverse of absolute temperature) for Kamp when the diffusion and amplification rate constants have different activation energies (diffusion activation energy = 26.5 kcal/mol, reaction activation energy = 45 kcal/mol).
Chris A. Mack, Fundamental Principles of Optical Lithography, (c) 2007 Figure 6.7. Example of PEB amplification kinetics measured by using thickness loss after PEB to estimate the fraction of polymer that remains blocked.
Chris A. Mack, Fundamental Principles of Optical Lithography, (c) 2007 Figure 6.8. Example Poisson distributions for a typical 193-nm resist (G0NA = 0.042 /nm3): a) volume of 64 nm3; b) volume of 216 nm3; and c) volume of 1000 nm3. For (c), a Gaussian distribution with the same standard deviation as the Poisson distribution is shown as a solid line.
Chris A. Mack, Fundamental Principles of Optical Lithography, (c) 2007 Figure 6.9. Comparison of the approximate 1D CovPSF of equation (6.97) with a numerical evaluation of the defining integral in equation (6.94).
Chris A. Mack, Fundamental Principles of Optical Lithography, (c) 2007 Figure 6.10. The relative uncertainty of the relative blocked polymer concentration as a function of the volume (= length cubed) under consideration and the diffusion length of acid for a two-dimensional problem. Typical 193-nm resist values were used: G0NA = 0.042 /nm3, M0NA = 1.2 /nm3, KamptPEB = 2, and for an exposure such that <h> = 0.4.