Download
1 / 57
590 likes | 735 Vues
Pavement Thickness Evaluation Using Ground Penetrating Radar. Dwayne Harris Presented for Final Exam. OUTLINE. Introduction Fundamentals of GPR Interpretation of GPR data Methodologies for Thickness Evaluation GPR Data Quality Validation of Methodologies. Introduction.

E N D
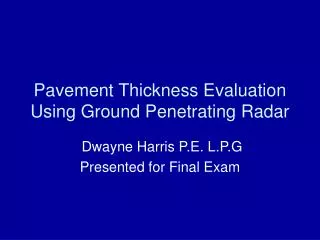
Pavement Thickness Evaluation Using Ground Penetrating Radar Dwayne Harris Presented for Final Exam
OUTLINE • Introduction • Fundamentals of GPR • Interpretation of GPR data • Methodologies for Thickness Evaluation • GPR Data Quality • Validation of Methodologies
Introduction • Background on pavement thickness evaluation • Literature review
Significance of Thickness Information • Pavement management • Pavement performance and remaining life estimates require knowledge of pavement thickness • Setting maintenance and rehabilitation priorities • Main input in overlay design • INDOT Major Moves $138,483,477 budgeted for 2006 resurfacing • Thickness of uppermost surface course needed for mill and Fill resurfacing projects. • Pavement thickness is needed for project level FWD structural analysis
National Pavement Rehabilitation [Hartegen, 2005]
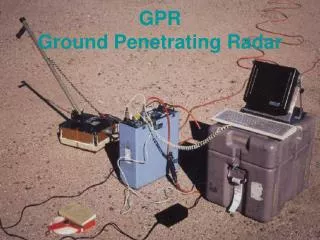
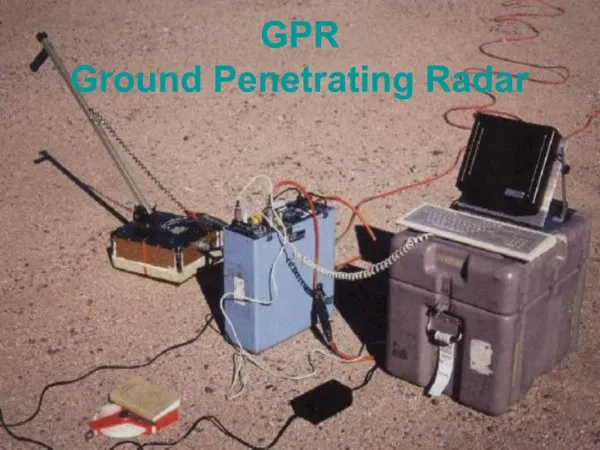
Technologies Used for Pavement Thickness Evaluation • Core • Costly • Destructive • Provides a good ground truth record. • Falling Weight Deflectometer (FWD) • None Destructive • Ground Penetrating Radar • Non Destructive • Collected at Highway Speed • Dense Coverage • Heavy Post Processing
Related Work on Thickness Evaluation • [Berge et al, 1986] initial pavement thickness studies • [Livneh and Siddiqui, 1992] mathematical model • [Fernando, 2000; Scullion and Saarenketo, 2002] automated interface identification • [Al-Quadi et al, 2005] model expanded to three or more layers Summary • There are multiple models available for pavement thickness evaluation • The model selected for this study is utilized for a large majority of the studies • Current literature suggests using semi-automatic data interpretation methodologies
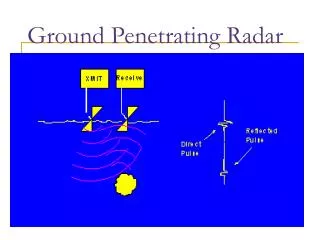
Fundamentals • GPR trace and waveforms and data presentations • Mathematical model
Principles of GPR Interface Interpretation An interface is defined as the anomaly in GPR data occurring when the reflected waveforms from a physical pavement boundary are contiguous for a group of sequential traces • The radar (EM) wave must propagate, to the interface and back. • The radar wave must reflect off the interface with enough energy to be recorded. • The interface must be identified in the GPR record.
Methodologies for Thickness Evaluation (regional M1) • Top layer methodology • Discontinuities are located in data • Interfaces are identified in the data • Regional dielectric constants are determined • Thickness values are calculated for each mile • Enhanced to calculate thickness using dielectric constants from individual traces
Thickness Calculation • Every thickness pick is assigned the respective regional dielectric value. • Thickness Values Calculated. • Average value calculated for each mile.
Multiple Layer Methodology (M2) • Determine the layers to be modeled • Form data set of possible interfaces • Select interfaces to be modeled • Calculate thickness values • Present the thicknesses in a visually acute format allowing for proper interpretation
Quality of GPR Data • Blunders • Improper waveform selection • Omitted pavement layers • Systematic errors • Travel time systematic error • Velocity systematic error • Random errors • Error propagation
Improper Waveform Selection I-65 Study Area13 Inches HMA Over PCC
Difference in Dielectric Constant and Thickness Negative Phase Dielectric Constant Positive Phase Thickness Positive Phase Dielectric constant Negative Phase Thickness
Omitted Pavement Layers Thickness (Layers Omitted) Thickness (All Layers)
Error Summary • Improperly selecting waveforms is a significant blunder source • Utilizing automated interface selection algorithm increased the likelihood of this blunder • Omitting pavement layers introduces errors • Channel 1 data not used due to large systematic error is travel time • Velocity systematic errors propagate into thickness error • Amplitude random error propagates to about 1% relative thickness error
Validation of Methodologies • Comparison with 3rd party Software • Comparison of methodologies developed • Thickness variation • Network thickness study • GPR thickness evaluation accuracy
Thickness Comparisons • Seven pavement sections of three interstates. • Pavement sections of three state roads • Five pavement sections of two interstates used for 3rd party comparison
Statistical Analysis (M2 vs TERRA) • Population Intersection • Split into 50 or 25 foot subsections • Normality, F test, and T-test analysis • Explanation of T-test results
Normality Analysis of Sub Section Populations H0=Population Normally Distributed Alpha=95%
Equality of Means and Variance Analysis of Sub Section Populations H0=Populations Have Same Variance Alpha=95% H0=Populations Have Same Means Alpha=99%
I-65 T-test 8% Rejected Worst Case Best Case
I-74F T-test 72% Rejected Best Case Worst Case
Summary M2 TERRA Comparison • 90% of the M2 and TERRA populations have the same variance (alpha=95%) • 98% of the M2 and TERRA populations for I-65 have the same mean (alpha=99%) • 28% of the M2 and TERRA populations for I-74F have the same mean
Methodology Comparisons • Effect of sample size • Effect of using regional dielectric constant
Network Thickness Evaluation Over 1,600 Miles Evaluated Uppermost Surface Course Thickness Evaluated with GPR Using Regional M1 Method Pavement Structure Thickness Evaluated with FWD
Network Thickness Evaluation • A majority of the INDOT interstate system is 25 inches thick with an uppermost surface course thickness of 5 to 7 inches of HMA. • GPR provided reasonable estimates of the uppermost surface course thickness • FWD provided reasonable estimates of the pavement structure thickness