Download
1 / 27
270 likes | 410 Vues
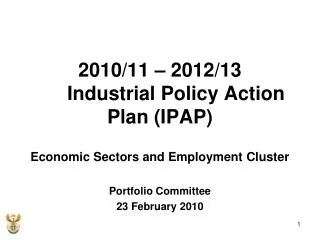
Economic Sector and Employment Cluster. Presentation to the Portfolio Committee on Public Service and Administration Cluster briefings on the Millennium Development Goals Tuesday, 23 August 2011 Committee Room 1, 12O Plein Street ,CAPE TOWN. Outline of the Presentation. Background

E N D
Economic Sector and Employment Cluster Presentation to the Portfolio Committee on Public Service and Administration Cluster briefings on the Millennium Development Goals Tuesday, 23 August 2011 Committee Room 1, 12O Plein Street ,CAPE TOWN
Outline of the Presentation • Background • Purpose • Linkage between Economic Sector and Employment Cluster POA and MDGs (ESEC) • Economic Sector and Employment Cluster contribution and progress to the MDGs • Conclusion Presentation to the Portfolio Committee on Public Service and Administration: Cluster briefings on the Millennium Development Goals
Purpose • The purpose of this presentation is to present contribution made by the ES&ECon the implementation of the Millennium Development Goals (MDGs) • The presentation also seeks to provide the linkage between the ESEC POA and MDGs • The progress report covers the period 1 October 2010 to 31 May 2011 Limitations: • The direct impact of the implementation of the POA to the achievement of the MDGs has not yet been measured • The report does not cover all the indicators Presentation to the Portfolio Committee on Public Service and Administration: Cluster briefings on the Millennium Development Goals
Background • The Millennium Development Goals (MDGs) come from the UN Millennium Declaration signed by 189 countries, including 147 Heads of State and Government, in September 2000, and from further agreement by member states at the 2005 World Summit • The Government has integrated the MDGs into its Medium Term Strategic Framework 2009-2014, translating the five priorities of the ruling party into Ten Strategic Priorities for Government. • The coordination of the MDGs has been assigned by to Statistics South Africa (STATSSA) which coordinates inputs from Government departments and civil society organisations on the implementation of MDGs • A full country progress report was presented at the United Nations in 2010 and to this committee by the Social Protection and Community Development Cluster on 29. 06.2011 Presentation to the Portfolio Committee on Public Service and Administration: Cluster briefings on the Millennium Development Goals
Economic Sector and Employment Cluster contribution and progress to the MDGs Presentation to the Portfolio Committee on Public Service and Administration: Cluster briefings on the Millennium Development Goals
Cluster programmes contributing to the achievement of the MDGs • Outcome No. 4: Decent employment through inclusive economic growth • Outcome No 5: A skilled and capable workforce to support an inclusive growth path • Outcome No. 7: Vibrant, equitable, sustainable rural communities and food security for all • Outcome No. 10: Protect and enhance our environmental assets and natural resources Specific Sector Programmes/ Strategies e.g. • The New Growth Path , IPAP2, • Expanded Public Works and Community Works Programmes • Comprehensive Rural Development Programme • Local Economic Development Cross cutting activities and programmes implemented by other clusters or outcomes • e.g. Outcome 6 on infrastructure and 9 on service delivery Presentation to the Portfolio Committee on Public Service and Administration: Cluster briefings on the Millennium Development Goals
Linkage between Economic Sector and Employment Cluster POA and MDGs Presentation to the Portfolio Committee on Public Service and Administration: Cluster briefings on the Millennium Development Goals
Linkage between Economic Sector and Employment Cluster POA and MDGs Presentation to the Portfolio Committee on Public Service and Administration: Cluster briefings on the Millennium Development Goals
MDG 1: Eradicate extreme poverty and hunger Presentation to the Portfolio Committee on Public Service and Administration: Cluster briefings on the Millennium Development Goals
Progress Food security Central to improving the productivity, economic viability and sustainability of small and large farm enterprises - sustainable agrarian reform is critical. • There is a substantial improvement on access to diverse and affordable food • Approximately 8 909 households have been provided with inputs • 43 321 households/community/public/institution food gardens have been established to enable households and communities to produce their own food. • 370 households have been linked to Community Nutrition Development Centre (CNDCs) and 8 125 695 learners received nutritious meals in schools reducing the number of undernourished children • Approximately 233 698.62 hectares of strategically located land were acquired and redistributed benefitting 3 052 beneficiaries • 7 705 smallholder farmers were provided with agricultural and technical support • 427 distressed farms are at various stages of the Recapitalisation and Development Programme and 11 irrigation schemes are under revitalisation. • 1 250 smallholder farmers were established. • 2 Agri-parks have been established in the Eastern Cape (Alice and Idutywa) Presentation to the Portfolio Committee on Public Service and Administration: Cluster briefings on the Millennium Development Goals
Progress (continued) • Using a R524 poverty line, poverty headcount index decreased from 58% in 2000 to 49% in 2008. • Using a R283 poverty line, poverty headcount decreased from 38% in 2000 to 22% in 2008. • The decline in poverty headcount is largely due to an increase in social grant uptake. • In support of the New Growth Path (NGP) jobs have been created through implementation of different outcomes e.g. • 5 215 jobs have been created in land reform projects • 8 887 jobs have been created through National Rural Youth Services Corps (NARYSEC) • 540 423 work opportunities and 137525 permanent jobs through EPWP including through the Community Works Programme in rural areas Presentation to the Portfolio Committee on Public Service and Administration: Cluster briefings on the Millennium Development Goals
Progress (continued) Job creation • EPWP- The programme has since inception of Phase 2 created 1,268,975 work opportunities cumulatively. • The work opportunities have benefited over 51% youth, 62 % of women and 0.4% people living with disabilities. • As part of the Integrated Nation Energy Programme (INEP) approximately 200 000 new connections are made annually. The table below provides an overall view of the socio-economic contribution made by the electrification programme in 2010, including total number of jobs created as a result of the electrification programme. Source: Department of Energy (Inputs to Economic Sectors and Employment Employment Cluster contribution to MDGs) • 63 000 formal non-agriculture jobs were created between April and October 2010 (Outcome 4 Report: 23 Feb 2011) Presentation to the Portfolio Committee on Public Service and Administration: Cluster briefings on the Millennium Development Goals
Progress (continued) • In 2010, government approved the New Growth Path that seeks to create 5 million jobs by 2010 and address the inequalities and high poverty levels that are prevalent in South Africa. • In January Cabinet approved the phased in approach to job creation starting with a target of 250000 • About 150 000 jobs were created in the six months to March 2011, almost exclusively in the formal sector • According to the Development Indicators published by the Presidency, the monthly real income of the poorest 10% of the population increased from R742 in 1995 to R1386 in 2008/09. • For the richest 10 % it almost doubled increasing from R13 416 to R26 602. • Using the gini-coefficient, inequality worsened from 0.64 to 0.66 in 2008. Presentation to the Portfolio Committee on Public Service and Administration: Cluster briefings on the Millennium Development Goals
Progress (continued) • Total employment (including both paid jobs and self-employment) is still well below 2008 levels • Still, employment creation turned around in the six months to March, especially taking seasonal issues into account Job losses in the two years to September 2010 • Marginalised sectors – informal, agriculture and domestic – accounted for 30% of employment but 37% of job losses • The formal sector lost 650 000 jobs; marginalised sectors lost 370 000 • Workers aged 16 to 30 account for 30% of the labour force but 60% of job losses in the downturn • Africans account for 70% of employment but 85% of job losses in the downturn - and most of the recovery Gains in the six months to March 2011 • The formal sector gained 175 000 jobs in the six months to March 2011, while the marginalised sectors lost 30 000, partially due agriculture season • By extension, the most vulnerable are still losing livelihoods Presentation to the Portfolio Committee on Public Service and Administration: Cluster briefings on the Millennium Development Goals
To halve the portion of proportion of people whose income is less than 1 US Dollar per day • South Africa increased the real wages of workers covered by sectoral determinations during the 2001 to 2010 period, particularly the wages of Domestic and Farm workers. • Employment in sectors covered by minimum wage legislation also grew significantly over this period, at around 2.9 percent per annum, whilst output grew by 4.6 percent. • Overall, employment in South Africa of workers covered by minimum wage legislation grew at a rate of 2.9 percent per annum from nearly 3.5 million in 2001 to over 4 million in 2007. • 7324 out of 25449 registered work seekers were placed in employment by the end of 2010 Presentation to the Joint Cluster Meeting on the Millennium Development Goals
MDG 3. Promote gender equality and empower women (DOL) Progress up to end of December 2010 • 19 companies were assisted through the DoL/DHET training lay-off scheme benefiting 6351 workers • 52853 women assisted to access the employment services interventions • 64615 young people assisted to access the employment services interventions • 766 people with disabilities assisted to access the employment services interventions Progress in terms of representation of women in positions with decision making powers was as follows in 2010: • Top management level- women constituted 18.2% in 2008 & 19.0% in 2010 . • Senior Management level – women constituted 28.3% in 2008 and 29.3% in 2010 Presentation to the Joint Cluster Meeting on the Millennium Development Goals
MDG Country report 2011 Proportion of households by poverty status and sectoral determination of household Millineum Development Goals: Progress Report
MDG 7: Ensure Environmental Sustainability Presentation to the Portfolio Committee on Public Service and Administration: Cluster briefings on the Millennium Development Goals
MDG 7: Ensure Environmental Sustainability Generally, South Africa’s environment is deteriorating and the potential climate change impacts cannot be ignored . Natural resources are national economic assets and the SA economy depends heavily on energy and mineral resources, biodiversity, agriculture, forestry, fishing and eco-tourism. • Approximately 10 000 connections done annually using non-grid technologies. Thus, renewable energy is used in the electrification programme in rural areas which cannot be reached by grid electrification • This addresses not only the supply of a basic service like electricity, but also ensures that sustainable energy process are implemented. In this process the carbon footprint due to energy consumption is decreased. • Proportion of terrestrial area protected (as a % of total) is 6.20 (2010) • Proportion of marine area protected (as a % of total) is 6.54 (2010) • Carbon dioxide (CO₂) is the most significant of the three main greenhouse gases that SA emits, the others being methane (CH4) and nitrous oxide (N2O). • CO₂ contributed more than 80% of total emissions in 1990 and 1994. • The total CO₂ emissions have risen from 359 million metric tons in 1994 to 434 million metric tons in 2007 Presentation to the Portfolio Committee on Public Service and Administration: Cluster briefings on the Millennium Development Goals
MDG 8: Develop a Global Partnership for Development Presentation to the Portfolio Committee on Public Service and Administration: Cluster briefings on the Millennium Development Goals
8.F: In cooperation with the private sector, make available the benefits of new technologies, especially information and communications • Access to fixed line telephony has been declining over the past several years, On a per capita basis, the number of fixed telephone lines has declined 12% from 2001 to 2007 • To some extent this reflects a switch by consumers from fixed line to mobile telephony. • Cell phones not only have the advantage of being mobile, but were also quicker to implement prepaid billing, which is more compatible with the earnings pattern of low income consumers. • The decrease in the number of fixed lines does not only reflect pull factors to mobile telephony, but also problems with the fixed line market. • Mobile ICT methodologies are also commonly used to provide other forms of ICT services. • The International Telecommunication Union statistics suggest that in 2008, approximately 6 out of every 7 South African broadband subscriptions was via mobile rather than fixed technologies. Presentation to the Joint Cluster Meeting on the Millennium Development Goals
8.F: In cooperation with the private sector, make available the benefits of new technologies, especially information and communications • Progress in increasing access to the internet has been less successful than progress in access to mobile telephony. • the proportion of homes/households with access to the internet has risen from only 7.2% in 2007 to 11.1% in 2009. • The highest levels of access are clustered in areas of high per capita GDP, in particular the Western Cape and Gauteng. • Homes/households in these provinces are around 8 times more likely to have internet access than those in Limpopo, the province with the lowest internet access levels. Presentation to the Joint Cluster Meeting on the Millennium Development Goals
MDG 8: Develop a Global Partnership for Development: MDG 8 seeks to develop a global partnership for development. This includes promoting an open rules-based, predictable, non-discriminatory trading and financial system and addressing the special needs of the least-developed countries (LDCs). • The current playing field in trade is uneven and biased against developing countries’ interests. Key challenges persist in achieving MDG Goal 8. • The launch of the WTO’s Doha Development Agenda in 2001 promised to place the needs and interests of developing countries at the heart of the Doha Work Programme. • However, the development mandate of the Doha Round is gradually being eroded. • Developed countries have an aggressive market opening agenda directed at the emerging developing economies like South Africa in the areas of industrial tariffs and services, while maintaining high levels of protection in agriculture. Presentation to the Portfolio Committee on Public Service and Administration: Cluster briefings on the Millennium Development Goals
Conclusion • Need for alignment between MDGs and Outcomes indicators and targets to ensure correct reporting • The Cluster will continue to work on improving alignment in reporting between MDGs and its programmes and outcomes • The Cluster will also implement 12 Action plans for immediate action by government as adopted by July Lekgotla • These priorities reflect an assessment of where concrete, high-level interventions are needed to achieve governments aims • Need to measure the direct impact of each cluster programmes to the achievement of the MDGs THANK YOU!