Download
1 / 2
20 likes | 229 Vues
Financial Econometrics and Statistical Arbitrage. Master of Science Program in Mathematical Finance New York University Homework 3 Due on Monday Nov. 7 th , 2005 (Two Weeks) Fall 2005. 70. 60. 50. 40. 30. 20. 10. 0. -10. 0. 100. 200. 300. 400. 500. 600. 700. 800. 900.

E N D
Financial Econometrics and Statistical Arbitrage Master of Science Program in Mathematical Finance New York University Homework 3 Due on Monday Nov. 7th, 2005 (Two Weeks) Fall 2005
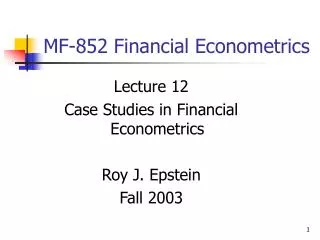
70 60 50 40 30 20 10 0 -10 0 100 200 300 400 500 600 700 800 900 1000 Homework 3 Problem 1: Consider the daily stock prices of two companies A and B (Stocks.xls). Use the Engle-Granger Method and show that the stock prices are cointegrated. Find the cointegration vector. (80% of the score) Problem 2: Design a pairs trading strategy based on your cointegration vector and assuming transaction cost for each trade is $5.00, find the approximate optimal trading thresholds as in Lecture 5*. (15% of the score) Problem 3: Obtain the mean-reversion speed*. (5% of the score) * Use Monte Carlo Simulation