Download
1 / 19
530 likes | 1.94k Vues
Low-Carbohydrate Diets. Erin Lastnik BS, DTR Dietetic Technician UPMC Shadyside Hospital July 10, 2012. Outline. Definition of carbohydrate Definition of a “low-carbohydrate” diet Current Recommendations Risks and Dangers Weight-loss Role of Insulin Type 2 Diabetes Heart Disease

E N D
Low-Carbohydrate Diets Erin Lastnik BS, DTR Dietetic Technician UPMC Shadyside Hospital July 10, 2012
Outline • Definition of carbohydrate • Definition of a “low-carbohydrate” diet • Current Recommendations • Risks and Dangers • Weight-loss • Role of Insulin • Type 2 Diabetes • Heart Disease • Friedewald Equation • LDL Particle Size
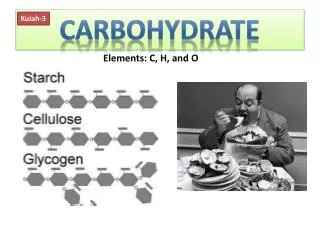
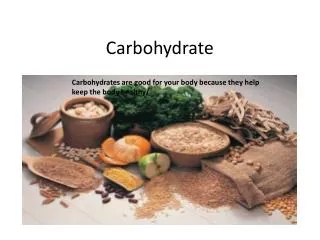
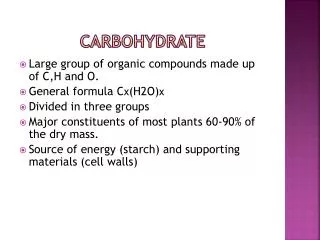
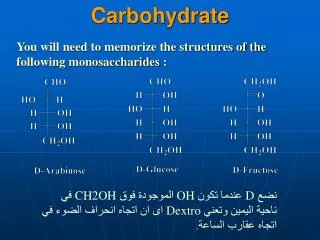
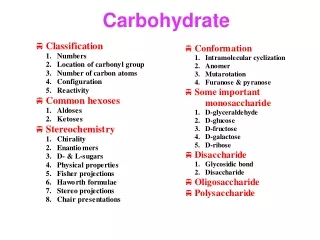
What is a Carbohydrate? • Organic molecule consisting of carbon, hydrogen and oxygen • Four classifications • Monosaccharides and disaccharides (sugars) • Oligosaccharides and polysaccharides (starches) • One of the three macronutrients in the human diet • Found in the diet as breads, pasta, fruit, etc. • 4 kcal/g • Stored in the body as glycogen and used for fuel
Low-Carbohydrate Diets • Very-Low-Carbohydrate (VLC)/Ketogenic • ~10% of total calories • (2000 kcal x 0.1 = 200 kcal; 200 kcal/4 kcal/g) = 50 g/day of CHO • Low-Carbohydrate (LC) • ~20% of total calories • (2000 kcal x 0.2 = 400 kcal; 400 kcal/4kcal/g) = 100 g /day of CHO
Current Recommendations • The current FDA recommendations (based on 2000 kcal/day) • Carbohydrate: 300 g/day = 1200 calories (60% of total calories) • Fat: 65g/day = 585 calories (~30% of total calories) • Protein: 2000 kcal/day x 0.1 = 200 kcal/kcal/g = 50 g/day • While the American Diabetes Association encourages less starches on the plate, they still advocate 45-60 g of CHO per meal (90-180 g/day) • American Heart Association • Carbohydrate (only including fruit [4] and grain [6] servings): 150 g/day • Not factoring for CHO in dairy, starchy vegetables, or legumes
Possible Risks and Dangers of a Low-Carb Diet • Protein is replacing Carbohydrate • Renal stress • Lack of nutrients • Important to incorporate starchy vegetables and fruit as CHO sources • No regard for fat • Depends on the person • Much research on different types of fat • Ketosis • Not to be confused with ketoacidosis • Ketones are actually the preferred fuel for skeletal muscles, the heart, the liver and the brain
Obesity and Weight Loss: Challenging “Calories In-Calories Out” • CHO enters the bloodstream post-digestion as glucose • Blood sugar levels rise and trigger the release of insulin • Glucose -> Glycogen storage • Limited storage for glucose -> conversion to free fatty acids via de novo lipogenesisin the liver • Cells develop “insulin resistance” -> more insulin is released to compensate • Insulin is an anabolic hormone • Regulation of fat storage • Insulin is the top regulator of Lipoprotein Lipase (LPL) • LPL is the main enzyme breaks down fatty acid stores for fuel • Insulin inhibits the function of LPL • http://www.youtube.com/watch?v=mNYlIcXynwE
Very Low-Carb vs. Very Low Fat Diets on Weight Loss • 2004 University of Connecticut Study • 15 men (Age 33, BMI 34), 13 women (Age 34, BMI 29) • Weight loss, body composition, trunk fat, resting energy expenditure (REE) • Randomly assigned to a Very-Low-Carbohydrate diet or a Low Fat Diet • VLC: Carbohydrate 10%, Fat 60%, Protein 30% of total calories • Low Fat: Carbohydrate 55%, Fat 25%, Protein 20% of total calories • Halfway through, volunteers switched diets • Food diaries recorded during three 1 week intervals • VLC: Men 1855 kcal/day, Women 1288 kcal/day • Low Fat: Men 1562 kcal/day, Women 1243 kcal/day • Results • In all categories, the VLC diet was superior • VLC to Low Fat: volunteers regained trunk fat mass • Overall weight loss was greater for each group during the VLC phase • REE decreased in both diets • Trunk fat/Body composition ratio was greater on VLC
Type 2 Diabetes • Characterized mainly by “insulin resistance” • Data from the 2011 National Diabetes Fact Sheet (released Jan. 26, 2011) from the American Diabetes Association • Total prevalence of diabetes • Total: 25.8 million children and adults in the United States—8.3% of the population—have diabetes. • Diagnosed: 18.8 million people • Undiagnosed: 7.0 million people • Prediabetes: 79 million people* • New Cases: 1.9 million new cases of diabetes are diagnosed in people aged 20 years and older in 2010.
Low-Carb vs Low-Fat Diets Effects on Glycemic Control in Type 2 Diabetics • Albert Einstein College of Medicine 2008 • 105 participants randomized to low-carb/low-fat diets • Food diaries showed low-carb averaged (24% of total kcal) and low-fat (52% total kcal) • Main focus was A1C (half life 120 days) measured at 3, 6, and 9 months • Weight, Blood pressure, Cholesterol, LDL, HDL, triglycerides • Results • A1C: Low-carb (7.5-0.95=6.55); Low-fat (7.4-0.65=6.75)
Heart Disease • American Heart Association • “Heart disease is the general term regarding plaque buildup in the artery walls. Over time, plaque builds up, the arteries narrow, obstructing blood flow and creating a risk for heart attack or stroke.” • “LDL (bad) cholesterol in the blood can build up in the arteries over time. With other substances, the collection hardens and forms a plaque. The artery in turn stiffens and can obstruct clots in the blood leading to heart attack or stroke.”
Friedewald Equation • LDL = Total cholesterol – HDL – TG/5 • Only “close” to true value if TG 150-250 mg/dl • Does not account for TG > 400 mg/dl or <100 mg/dl • 200 mg/dl – 60 mg/dl – (70 mg/dl/5) = 126 LDL • 200 mg/dl – 60 mg/dl – (300 mg/dl/5) = 80 LDL • Current recommended fasting TG level: 150mg/dl • VAP Test directly measures LDL • Triglyceride/HDL; ratio under 2 – correlates with Type A Pattern • 70mg/dl / 60 mg/dl = 1.16 • 300mg/dl / 60 mg/cl = 5
LDL and Particle Size • Low-Density Lipoprotein (LDL): one of the five groups of lipoproteins that transport multiple types of fat throughout the body • De novo Lipogenesis: the conversion of CHO to fat in the liver results in a different LDL particle size • Type A Pattern: larger and less dense • Type B Pattern: smaller and more dense • Enter inflamed endothelium more easily • More susceptible to oxidation than Type A Pattern
Low-Carb and Heart Disease Risk • In the context of serum lipid biomarkers identified as “heart disease risk” markers • LDL particle size, fasting TG, HDL, LDL, total cholesterol • Women’s Study Very Low-Carb vs Low-Fat • Particle size: Low-carb had a statistically significant increase in particle size, Low-fat had no significant change • TC 183: VLC – 185, LF – 170 • LDL 113: VLC – 119, LF – 107 • HDL 52: VLC – 53, LF – 48 • TG 89: VLC – 69, LF – 79 • Men’s Study VLC vs Habitual (48% CHO) • Particle Size: VLC had a statistically significant increase in peak particle size • TC : VLC: 165 – 173, Habitual: 164-158 • LDL : VLC: 111 – 166 (temp increase ), Habitual: 111 – 106 • HDL: VLC: 47-53, Habitual: 44 – 44 • TG: VLC: 96 – 65, Habitual: 101 – 96
References • Taubes, Gary. “Good Calories, Bad Calories”. Knopf Publishing, 2007. • Taubes, Gay. “Why We Get Fat”. Knopf Publishing, 2010. • Gropper, S. et al “Advanced Nutrition and Human Metabolism”. Wadsworth Cengage, 2009. • American Diabetes Association. “Carbohydrate Counting”. http://www.diabetes.org/food-and-fitness/food/planning-meals/carb-counting/. Accessed 11 June 2012. • Food and Drug Administration. “How To Understand and Use The Nutrition FactsPanel”.//www.fda.gov/Food/ResourcesForYou/Consumers/NFLPM/ucm274593.htm. Accessed 12 June 2012. • American Heart Association. http://www.heart.org/HEARTORG/GettingHealthy/NutritionCenter/HealthyDietGoals/Suggested-Servings-from-Each-Food-Group_UCM_318186_Article.jsp. Accessed 11 June 2012. • National Institutes of Health. “Coronary Heart Disease”. http://www.ncbi.nlm.nih.gov/pubmedhealth/PMH0004449/. Published 23 May 2011. Accessed 12 June 2012. • Eades, Michael. “LDL-Debunking the Myth”. http://www.proteinpower.com/drmike/weight-loss/low-carbohydrate-diets-increase-ldl-debunking-the-myth/. Published 22 June 2009. Accessed 12 June 2012. • Sharman, Matthew J. et al. “A Ketogenic Diet Favorably Affects Serum Biomarkers for Cardiovascular Disease in Normal-Weight Men”. J. Nutr. July 1, 2002 vol. 132 no. 7 1879-1885 . • Volek, Jeff S. et al. “Comparison of a Very Low-Carbohydrate and Low-Fat Diet on Fasting Lipids, LDL Subclasses, Insulin Resistance, and Postprandial Lipemic Responses in Overweight Women”. J. American College of Nutr. 2004. Vol 23, No. 2 177-184. • Volek, Jeff S. et all. “Comparison of energy-restricted very low-carbohydrate and low-fat diets on weight loss and body composition in overweight men and women”. Nutrition and Metabolism 2004 1:13. • Davis, Nichola J. et al. “Comparative Study of the Effects of a 1-Year Dietary Intervention of a Low-Carbohydrate Diet Versus a Low-Fat Diet on Weight and Glycemic Control in Type 2 Diabetes”. Diabetes Care July 2009 vol. 32 no. 7 1147-1152.