Download

1 / 38
380 likes | 500 Vues
Building Better Health. Fall/Winter 2010. OBESITY TRENDS 1985. BMI ≥30, or ~ 30 lbs. overweight for 5’ 4” adult. No Data <10% 10%–14% . Source: Behavioral Risk Factor Surveillance System, CDC. OBESITY TRENDS 1986. BMI ≥30, or ~ 30 lbs. overweight for 5’ 4” adult.

E N D
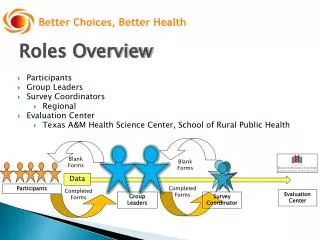
Building Better Health Fall/Winter 2010
OBESITY TRENDS1985 BMI ≥30, or ~ 30 lbs. overweight for 5’ 4” adult No Data <10% 10%–14% Source: Behavioral Risk Factor Surveillance System, CDC
OBESITY TRENDS1986 BMI ≥30, or ~ 30 lbs. overweight for 5’ 4” adult No Data <10% 10%–14% Source: Behavioral Risk Factor Surveillance System, CDC
OBESITY TRENDS1987 BMI ≥30, or ~ 30 lbs. overweight for 5’ 4” adult No Data <10% 10%–14% Source: Behavioral Risk Factor Surveillance System, CDC
OBESITY TRENDS1988 BMI ≥30, or ~ 30 lbs. overweight for 5’ 4” adult No Data <10% 10%–14% Source: Behavioral Risk Factor Surveillance System, CDC
OBESITY TRENDS1989 BMI ≥30, or ~ 30 lbs. overweight for 5’ 4” adult No Data <10% 10%–14% Source: Behavioral Risk Factor Surveillance System, CDC
OBESITY TRENDS1990 BMI ≥30, or ~ 30 lbs. overweight for 5’ 4” adult No Data <10% 10%–14% Source: Behavioral Risk Factor Surveillance System, CDC
OBESITY TRENDS1991 BMI ≥30, or ~ 30 lbs. overweight for 5’ 4” adult No Data <10% 10%–14% 15%–19% Source: Behavioral Risk Factor Surveillance System, CDC
OBESITY TRENDS1992 BMI ≥30, or ~ 30 lbs. overweight for 5’ 4” adult No Data <10% 10%–14% 15%–19% Source: Behavioral Risk Factor Surveillance System, CDC
OBESITY TRENDS1993 BMI ≥30, or ~ 30 lbs. overweight for 5’ 4” adult No Data <10% 10%–14% 15%–19% Source: Behavioral Risk Factor Surveillance System, CDC
OBESITY TRENDS1994 BMI ≥30, or ~ 30 lbs. overweight for 5’ 4” adult No Data <10% 10%–14% 15%–19% Source: Behavioral Risk Factor Surveillance System, CDC
OBESITY TRENDS1995 BMI ≥30, or ~ 30 lbs. overweight for 5’ 4” adult No Data <10% 10%–14% 15%–19% Source: Behavioral Risk Factor Surveillance System, CDC
OBESITY TRENDS1996 BMI ≥30, or ~ 30 lbs. overweight for 5’ 4” adult No Data <10% 10%–14% 15%–19% Source: Behavioral Risk Factor Surveillance System, CDC
OBESITY TRENDS1997 BMI ≥30, or ~ 30 lbs. overweight for 5’ 4” adult No Data <10% 10%–14% 15%–19% 20%–24% Source: Behavioral Risk Factor Surveillance System, CDC
OBESITY TRENDS1998 BMI ≥30, or ~ 30 lbs. overweight for 5’ 4” adult No Data <10% 10%–14% 15%–19% 20%–24% Source: Behavioral Risk Factor Surveillance System, CDC
OBESITY TRENDS1999 BMI ≥30, or ~ 30 lbs. overweight for 5’ 4” adult No Data <10% 10%–14% 15%–19% 20%–24% Source: Behavioral Risk Factor Surveillance System, CDC
OBESITY TRENDS2000 BMI ≥30, or ~ 30 lbs. overweight for 5’ 4” adult No Data <10% 10%–14% 15%–19% 20%–24% Source: Behavioral Risk Factor Surveillance System, CDC
OBESITY TRENDS2001 BMI ≥30, or ~ 30 lbs. overweight for 5’ 4” adult No Data <10% 10%–14% 15%–19% 20%–24% 25%–29% Source: Behavioral Risk Factor Surveillance System, CDC
OBESITY TRENDS2002 BMI ≥30, or ~ 30 lbs. overweight for 5’ 4” adult No Data <10% 10%–14% 15%–19% 20%–24% 25%–29% Source: Behavioral Risk Factor Surveillance System, CDC
OBESITY TRENDS2003 BMI ≥30, or ~ 30 lbs. overweight for 5’ 4” adult No Data <10% 10%–14% 15%–19% 20%–24% 25%–29% Source: Behavioral Risk Factor Surveillance System, CDC
OBESITY TRENDS2004 BMI ≥30, or ~ 30 lbs. overweight for 5’ 4” adult No Data <10% 10%–14% 15%–19% 20%–24% 25%–29% Source: Behavioral Risk Factor Surveillance System, CDC
OBESITY TRENDS2005 BMI ≥30, or ~ 30 lbs. overweight for 5’ 4” adult No Data <10% 10%–14% 15%–19% 20%–24% 25%–29% ≥30% Source: Behavioral Risk Factor Surveillance System, CDC
OBESITY TRENDS2006 BMI ≥30, or ~ 30 lbs. overweight for 5’ 4” adult No Data <10% 10%–14% 15%–19% 20%–24% 25%–29% ≥30% Source: Behavioral Risk Factor Surveillance System, CDC
OBESITY TRENDS2007 BMI ≥30, or ~ 30 lbs. overweight for 5’ 4” adult No Data <10% 10%–14% 15%–19% 20%–24% 25%–29% ≥30% Source: Behavioral Risk Factor Surveillance System, CDC
OBESITY TRENDS2008 BMI ≥30, or ~ 30 lbs. overweight for 5’ 4” adult No Data <10% 10%–14% 15%–19% 20%–24% 25%–29% ≥30% Source: Behavioral Risk Factor Surveillance System, CDC
OBESITY TRENDS2009 BMI ≥30, or ~ 30 lbs. overweight for 5’ 4” adult No Data <10% 10%–14% 15%–19% 20%–24% 25%–29% ≥30% Source: Behavioral Risk Factor Surveillance System, CDC
What does 3-4-50 look like in San Diego? www.SDHealthStatistics.com
What is the Economic Impact? www.SDHealthStatistics.com
Building a Better System • Supporting Healthy Choices • Policy and Environmental Change • Changing the Culture from Within Building Better Health Framework
Building Better Health in action:Communities Putting Prevention to Work(CPPW)
Working Together at All Levels / Individuals Families Neighborhoods Businesses Government Policies and Laws