Download
1 / 22
220 likes | 326 Vues
Electricity Generation Mix by US Industrial Sectors. Disaggregating Electricity Generation and Modeling Interstate Transfers Joe Marriott, Carnegie Mellon University Advisor Scott Matthews. InLCA/LCM September 2003. Why Disaggregate?.

E N D
Electricity Generation Mix by US Industrial Sectors Disaggregating Electricity Generation and Modeling Interstate Transfers Joe Marriott, Carnegie Mellon University Advisor Scott Matthews InLCA/LCM September 2003
Why Disaggregate? • Primary contributor to environmental impact is electricity generation • Impacts by generation type varies a lot • e.g. Hydro versus coal • This variation should be reflected in LCA results • For example: Aluminum manufacturing • Industry sector has emission numbers reduced due to plants in WA, which has 80% hydroelectric generation Joe Marriott - Carnegie Mellon University
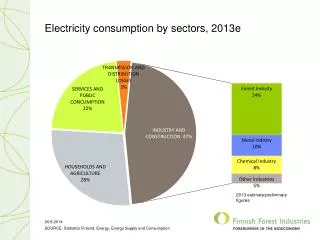
Currently in LCA • Use aggregate US generation mix to calculate emissions, GWP, etc. Net Electricity Generation by Energy Source, 1999 Joe Marriott - Carnegie Mellon University
Disaggregate Results • Rather than a single sector: “Electric services (Utilities)” • Have multiple electricity sectors: “Electric services (Utilities, Coal)” “Electric services (Utilities, Nuclear)” etc. • Each industrial sector would receive a specific mix of these disaggregated electricity sectors Joe Marriott - Carnegie Mellon University
Making It Happen • Data is not readily available • Need complete facility-level transaction data for all US industrial sectors • No central repository of this data • Economic data not necessarily a good estimate • Instead, assign a specific generation mix to each industrial sector using: • “Locations” of industry sectors from BEA • State generation mixes from DOE Joe Marriott - Carnegie Mellon University
Sector Allocation to States • Need percentage of each industry sector located in each state • Available using a tool developed at Carnegie Mellon by Iavor Kostov and Scott Matthews • Economic Census location data from BEA used for placement • Then uses number of employees and shipments as measures of size and intensity to weight various sectors in various states Joe Marriott - Carnegie Mellon University
Include Interstate Trading • Lots of electricity transfer in the United States, especially following deregulation in 1996 • Currently, interstate electricity transfer ignored, but it’s a big part of the market • 30% of California power is imported • West Virginia exports 60% of theirs • These numbers have a significant impact, so new generation mixes are created for each state Joe Marriott - Carnegie Mellon University
Western US: Net Imports (TWh) +3.4 +14.6 +2.7 -10.0 +26.9 +2.8 +10.7 -5.6 -70.9 +16.6 +10.8 Joe Marriott - Carnegie Mellon University
Model: Linear Optimization • Using 2 large matrices (23 x 28), find out where imports likely came from by minimizing distance (hops) traveled • Classic transportation/distribution cost minimization problem • This still isn’t what is actually happening on the grid, but it’s a pretty good estimate Joe Marriott - Carnegie Mellon University
State “Hops” for California 3 2 3 4 1 2 4 3 4 1 2 3 0 4 1 2 3 1 Joe Marriott - Carnegie Mellon University
Complete US Hop Count Joe Marriott - Carnegie Mellon University
Complete US Hop Count Joe Marriott - Carnegie Mellon University
Completed Optimization, Showing Electricity Transactions in TWh Joe Marriott - Carnegie Mellon University
Generating the Generation Mix • Have the % of imports for each importing state • Example: CA imports 30% • Have the % of that imported amount that came from each exporter • AZ: 34%, MT: 3%, NM: 19%, UT: 4%, WA: 36% • Know the % mix of the amount from each importer • Arizona: 45% Coal, 10% Gas, 35% Nuclear, 10% Hydro • Multiply these 3 sets of percentages, normalize with existing generation mix to get the new values Joe Marriott - Carnegie Mellon University
The Next Generation (Mix) in CA Joe Marriott - Carnegie Mellon University
Electricity Allocation to Sectors • Now, apply each state’s generation mix to the percentage of all the industrial sectors in the state • 20% of all widgets are manufactured in CA, so 1/5 of the widget sector will have CA’s generation mix • Then sum the generation types across all sectors and states • Each sector now includes part of the generation mix for each state it’s located in Joe Marriott - Carnegie Mellon University
Results of Modification Industries with the highest specific electricity generation mix values (by energy source) in the U.S. economy Joe Marriott - Carnegie Mellon University
Aircraft Manufacturing Joe Marriott - Carnegie Mellon University
Dirty Laundry? And How! Joe Marriott - Carnegie Mellon University
United States: Well Oiled Joe Marriott - Carnegie Mellon University
Results Trend Towards Average Joe Marriott - Carnegie Mellon University
Contributions • Disaggregating adds accuracy to a critical sector in terms of environmental impact • Industrial sector generation mixes answer some interesting questions • Which sectors are vulnerable to shifts in fuel price or technology change? • What is the potential impact of carbon taxes on the US economy? • Import-export estimate an intuitive substitute for complete transmission grid analysis • Most industrial sectors have a mix close to the US average mix • Some interesting sectors have significant differences Joe Marriott - Carnegie Mellon University