Download
1 / 2

E N D
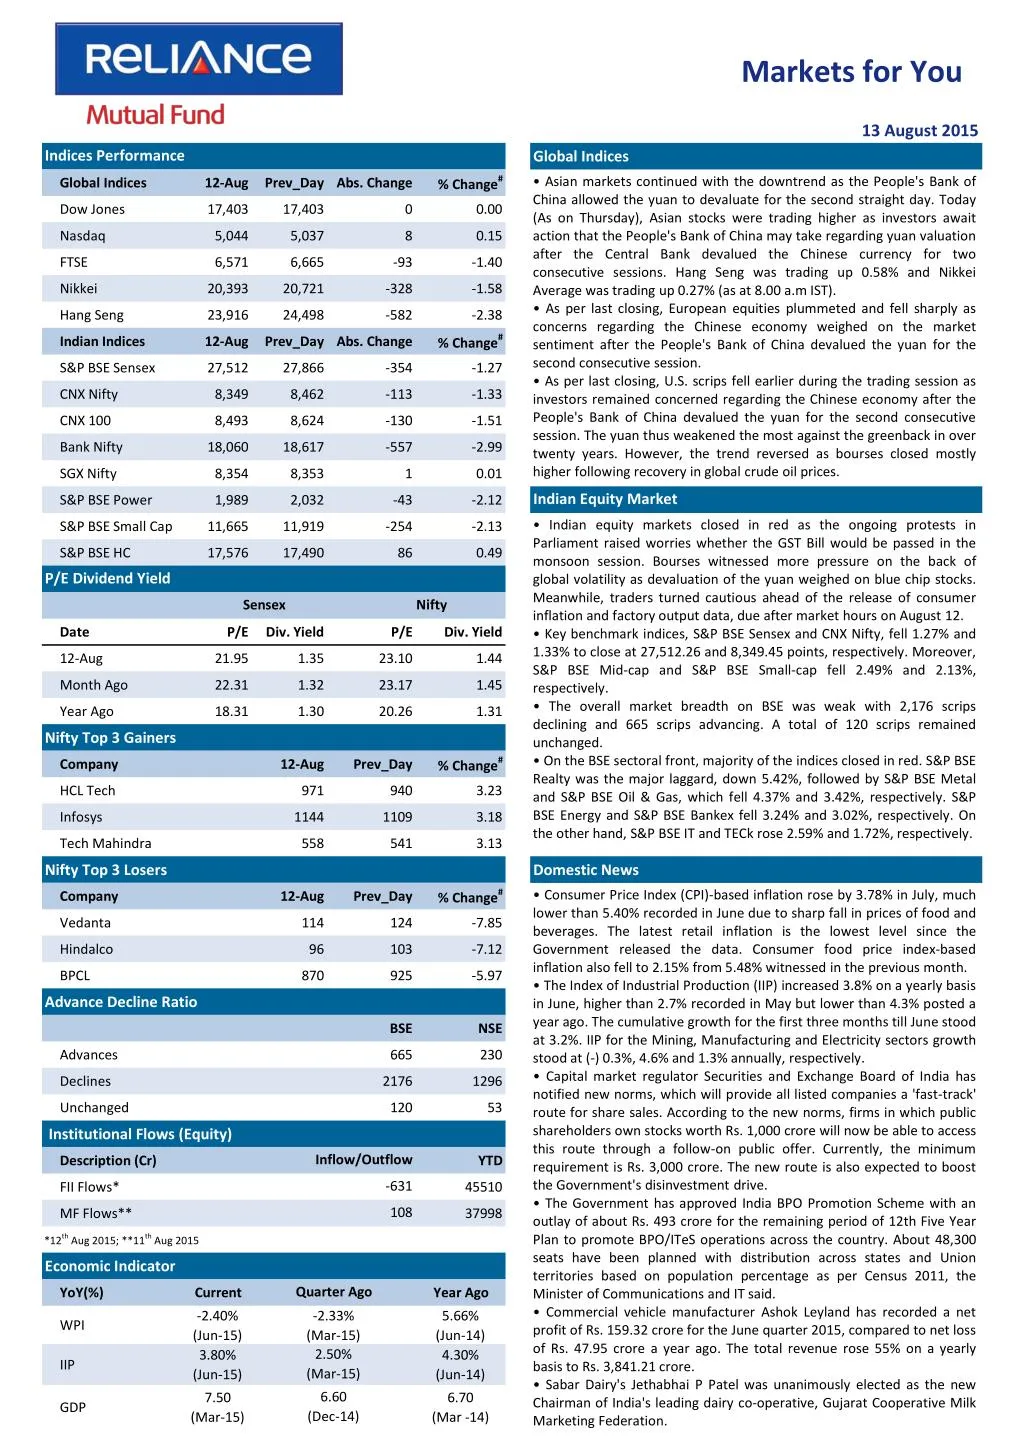
Markets for You 13 August 2015 Indices Performance Global Indices % Change# • Asian markets continued with the downtrend as the People's Bank of China allowed the yuan to devaluate for the second straight day. Today (As on Thursday), Asian stocks were trading higher as investors await action that the People's Bank of China may take regarding yuan valuation after the Central Bank devalued the Chinese currency for two consecutive sessions. Hang Seng was trading up 0.58% and Nikkei Average was trading up 0.27% (as at 8.00 a.m IST). • As per last closing, European equities plummeted and fell sharply as concerns regarding the Chinese economy weighed on the market sentiment after the People's Bank of China devalued the yuan for the second consecutive session. • As per last closing, U.S. scrips fell earlier during the trading session as investors remained concerned regarding the Chinese economy after the People's Bank of China devalued the yuan for the second consecutive session. The yuan thus weakened the most against the greenback in over twenty years. However, the trend reversed as bourses closed mostly higher following recovery in global crude oil prices. Global Indices 12-Aug Prev_Day Abs. Change Dow Jones 17,403 17,403 0 0.00 Nasdaq 5,044 5,037 8 0.15 FTSE 6,571 6,665 -93 -1.40 Nikkei 20,393 20,721 -328 -1.58 Hang Seng 23,916 24,498 -582 -2.38 % Change# Indian Indices 12-Aug Prev_Day Abs. Change S&P BSE Sensex 27,512 27,866 -354 -1.27 CNX Nifty 8,349 8,462 -113 -1.33 CNX 100 8,493 8,624 -130 -1.51 Bank Nifty 18,060 18,617 -557 -2.99 SGX Nifty 8,354 8,353 1 0.01 Indian Equity Market S&P BSE Power 1,989 2,032 -43 -2.12 • Indian equity markets closed in red as the ongoing protests in Parliament raised worries whether the GST Bill would be passed in the monsoon session. Bourses witnessed more pressure on the back of global volatility as devaluation of the yuan weighed on blue chip stocks. Meanwhile, traders turned cautious ahead of the release of consumer inflation and factory output data, due after market hours on August 12. • Key benchmark indices, S&P BSE Sensex and CNX Nifty, fell 1.27% and 1.33% to close at 27,512.26 and 8,349.45 points, respectively. Moreover, S&P BSE Mid-cap and S&P BSE Small-cap fell 2.49% and 2.13%, respectively. • The overall market breadth on BSE was weak with 2,176 scrips declining and 665 scrips advancing. A total of 120 scrips remained unchanged. • On the BSE sectoral front, majority of the indices closed in red. S&P BSE Realty was the major laggard, down 5.42%, followed by S&P BSE Metal and S&P BSE Oil & Gas, which fell 4.37% and 3.42%, respectively. S&P BSE Energy and S&P BSE Bankex fell 3.24% and 3.02%, respectively. On the other hand, S&P BSE IT and TECk rose 2.59% and 1.72%, respectively. S&P BSE Small Cap 11,665 11,919 -254 -2.13 S&P BSE HC 17,576 17,490 86 0.49 P/E Dividend Yield Sensex Nifty Date P/E Div. Yield P/E Div. Yield 12-Aug 21.95 1.35 23.10 1.44 Month Ago 22.31 1.32 23.17 1.45 Year Ago 18.31 1.30 20.26 1.31 Nifty Top 3 Gainers % Change# Company 12-Aug Prev_Day HCL Tech 971 940 3.23 Infosys 1144 1109 3.18 Tech Mahindra 558 541 3.13 Nifty Top 3 Losers Domestic News % Change# • Consumer Price Index (CPI)-based inflation rose by 3.78% in July, much lower than 5.40% recorded in June due to sharp fall in prices of food and beverages. The latest retail inflation is the lowest level since the Government released the data. Consumer food price index-based inflation also fell to 2.15% from 5.48% witnessed in the previous month. • The Index of Industrial Production (IIP) increased 3.8% on a yearly basis in June, higher than 2.7% recorded in May but lower than 4.3% posted a year ago. The cumulative growth for the first three months till June stood at 3.2%. IIP for the Mining, Manufacturing and Electricity sectors growth stood at (-) 0.3%, 4.6% and 1.3% annually, respectively. • Capital market regulator Securities and Exchange Board of India has notified new norms, which will provide all listed companies a 'fast-track' route for share sales. According to the new norms, firms in which public shareholders own stocks worth Rs. 1,000 crore will now be able to access this route through a follow-on public offer. Currently, the minimum requirement is Rs. 3,000 crore. The new route is also expected to boost the Government's disinvestment drive. • The Government has approved India BPO Promotion Scheme with an outlay of about Rs. 493 crore for the remaining period of 12th Five Year Plan to promote BPO/ITeS operations across the country. About 48,300 seats have been planned with distribution across states and Union territories based on population percentage as per Census 2011, the Minister of Communications and IT said. • Commercial vehicle manufacturer Ashok Leyland has recorded a net profit of Rs. 159.32 crore for the June quarter 2015, compared to net loss of Rs. 47.95 crore a year ago. The total revenue rose 55% on a yearly basis to Rs. 3,841.21 crore. • Sabar Dairy's Jethabhai P Patel was unanimously elected as the new Chairman of India's leading dairy co-operative, Gujarat Cooperative Milk Marketing Federation. Company 12-Aug Prev_Day Vedanta 114 124 -7.85 Hindalco 96 103 -7.12 BPCL 870 925 -5.97 Advance Decline Ratio BSE NSE Advances 665 230 Declines 2176 1296 Unchanged 120 53 Institutional Flows (Equity) Inflow/Outflow Description (Cr) YTD -631 FII Flows* 45510 108 MF Flows** 37998 *12th Aug 2015; **11th Aug 2015 Economic Indicator Quarter Ago YoY(%) Current Year Ago -2.40% (Jun-15) 3.80% (Jun-15) -2.33% (Mar-15) 2.50% (Mar-15) 5.66% (Jun-14) 4.30% (Jun-14) WPI IIP 6.60 (Dec-14) 7.50 6.70 GDP (Mar-15) (Mar -14)
Markets for You 13 August 2015 Derivatives Market FII Derivative Trade Statistics 12-Aug • Nifty August 2015 Futures were at 8,365.45 points, a premium of 16.00 points against the spot closing of 8,349.45 points. The turnover on NSE’s Futures and Options segment rose from Rs. 2,23,324.18 crore to Rs. 2,72,506.20 on August 12. • The Put-Call ratio stood at 0.89, compared to the previous session’s close of 0.90. • The Nifty Put-Call ratio stood at 0.87, compared to the previous session’s close of 0.92. • The open interest on Nifty Futures stood at 16.93 million compared to the previous session’s close of 17.46 million. (Rs Cr) Buy Sell Open Int. Index Futures 858.99 1716.02 15984.22 Index Options 12898.13 11640.71 71969.50 Stock Futures 2503.34 2594.58 50937.50 Stock Options 2838.83 2869.74 3245.42 Total 19099.29 18821.05 142136.64 Derivative Statistics- Nifty Options 12-Aug Prev_Day Change Indian Debt Market Put Call Ratio (OI) 0.87 0.92 -0.05 • Initially, bond yields fell ahead of the publication of consumer inflation data for July. However, gains were wiped out, after the rupee fell to a two-year low. • The yield on the 10-year benchmark bond, 7.72% GS 2025, remained steady at 7.80% compared to the previous day’s close. The paper moved in the range of 7.77% to 7.81% during the trading session. •Banks’ borrowings under the repo window of the Liquidity Adjustment Facility stood at Rs. 5,662 crore (gross) against Rs. 2,026 crore borrowed on August 11. Sale of securities by the RBI under the reverse repo window stood at Rs. 2,217 crore on August 11. • The RBI conducted the auction of 91-days and 182-days Treasury Bills for the notified amount of Rs. 8,000 crore and Rs. 6,000 crore, respectively. The cut-off for 91-days and 182-days T-Bill stood at Rs. 98.22 (7.27%) and Rs. 96.39 (7.51%), respectively. Put Call Ratio(Vol) 0.94 0.94 0.00 Debt Watch 12-Aug Wk. Ago Mth. Ago Year Ago Call Rate 7.11% 7.06% 7.09% 8.34% CBLO 7.23% 7.18% 6.82% 8.36% Repo 7.25% 7.25% 7.25% 8.00% Reverse Repo 6.25% 6.25% 6.25% 7.00% 91 Day T-Bill 7.25% 7.02% 7.43% 8.52% 364 Day T-Bill 7.56% 7.57% 7.59% 8.69% 10 Year Gilt 7.80% 7.84% 7.80% 8.62% Currency Market Update G-Sec Vol. (Rs.Cr) 29609 17972 32273 18259 • The rupee plunged against the dollar as investors turned cautious about emerging market assets after China’s Central Bank allowed devaluating its currency for the second consecutive day. The rupee fell 0.90% at 64.77 per dollar against the previous close of 64.19. • The euro gained against the dollar, tracking fall in the U.S. Treasury yields. China’s devaluation of the yuan increased doubts whether the U.S. Federal Reserve would raise interest rates in the near term. The euro was trading at $1.1147 compared to the previous close of $1.1040. 1 Month CP Rate 7.46% 7.50% 7.76% 8.68% 3 Month CP Rate 7.78% 7.83% 8.04% 9.16% 5 Year Corp Bond 8.43% 8.46% 8.54% 9.37% 1 Month CD Rate 7.29% 7.30% 7.47% 8.47% 3 Month CD Rate 7.46% 7.49% 7.70% 8.84% 1 Year CD Rate 7.87% 7.91% 8.05% 9.09% Currency Market Commodity Market Update • Gold prices rose after devaluation of the Chinese currency raised worries over a currency war. • Brent crude prices remained firmed after the International Energy Agency forecasted that the world oil demand would grow by 1.6 million bpd this year. Currency 12-Aug Prev_Day Change USD/INR 64.83 64.17 0.65 GBP/INR 101.00 99.85 1.15 International News EURO/INR 71.82 70.36 1.46 • China's industrial production rose 6% on a yearly basis in July, but slower than 6.8% increase in the previous month. Separately, retail sales growth in China eased to 10.5% in July from 10.6% in June. • Euro zone industrial production contracted 0.4% on a monthly basis in June, higher than a revised 0.2% fall (initial estimate of 0.4% drop) in May. This is the second consecutive decline in output. The drop was driven by a 1.8% fall in capital goods output and 2% fall in durable consumer goods production. • Wholesale inventories in the U.S. rose by 0.9% in June following a revised 0.6% increase in May, reflecting a notable rise in inventories of non-durable goods. Non-durable goods surged by 2.3% on the back of rise in inventories of farm product raw materials and petroleum and petroleum products. JPY/INR 0.52 0.51 0.01 Commodity Prices Currency 12-Aug Wk Ago Mth. Ago Year Ago NYMEX Crude($/bl) 43.22 45.13 52.74 97.36 Brent Crude($/bl) 47.79 49.39 57.32 101.58 Gold( $/oz) 1125 1085 1164 1308 Gold(Rs./10 gm) 25597 24631 26014 28469 Source: ICRON Research Disclaimer: “The information herein is meant only for general reading purposes and contains all factual and statistical information pertaining to Industry and markets which have been obtained from independent third-party sources and which are deemed to be reliable. The information provided cannot be considered as guidelines, recommendations or as a professional guide for the readers. It may be noted that since RCAM has not independently verified the accuracy or authenticity of such information or data, or for that matter the reasonableness of the assumptions upon which such data and information has been processed or arrived at; RCAM does not in any manner assures the accuracy or authenticity of such data and information. Some of the statements & assertions contained in these materials may reflect RCAM’s views or opinions, which in turn may have been formed on the basis of such data or information. The Sponsor, the Investment Manager, the Trustee or any of their respective directors, employees, affiliates or representatives do not assume any responsibility for, or warrant the accuracy, completeness, adequacy and reliability of such data or information. Whilst no action has been solicited based upon the information provided herein, due care has been taken to ensure that the facts are accurate and opinions given are fair and reasonable, to the extent possible. This information is not intended to be an offer or solicitation for the purchase or sale of any financial product or instrument. Recipients of this information should rely on information/data arising out of their own investigations. Before making any investments, the readers are advised to seek independent professional advice, verify the contents in order to arrive at an informed investment decision. None of the Sponsor, the Investment Manager, the Trustee, their respective directors, employees, affiliates or representatives shall be liable in any way for any direct, indirect, special, incidental, consequential, punitive or exemplary damages, including on account of lost profits arising from the information contained in this material. Mutual Fund Investments are subject to market risks, read all scheme related documents carefully.