Download
1 / 20
240 likes | 397 Vues
Science Tools, Data Tables, Graphs & Conclusions. Many of the things we do in science involve measuring and handling data…. We use various tools and devices to measure different quantities. We organize data into tables to find information easily.

E N D
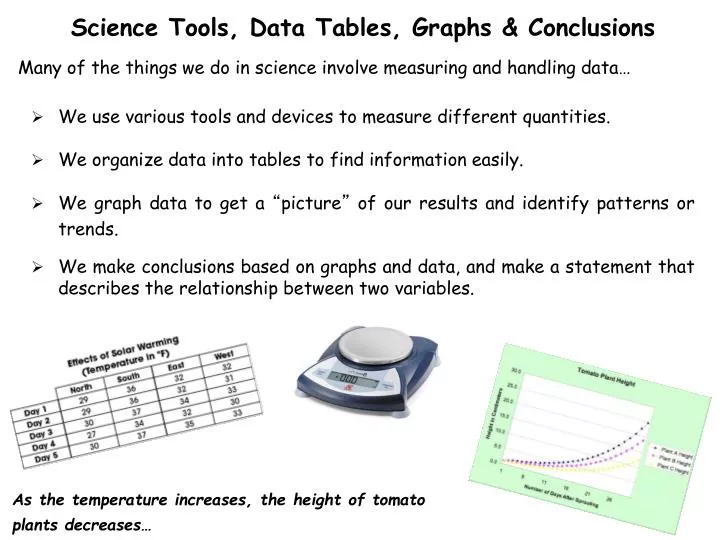
Science Tools, Data Tables, Graphs & Conclusions Many of the things we do in science involve measuring and handling data… • We use various tools and devices to measure different quantities. • We organize data into tables to find information easily. • We graph data to get a “picture” of our results and identify patterns or trends. • We make conclusions based on graphs and data, and make a statement that describes the relationship between two variables. As the temperature increases, the height of tomato plants decreases…
Science Quantities, Tools and Measurements 1 When we do ANY experiment, we often use some kind of tool to measure something. • When you measure something, you are measuring a certain quantity – an amount of something.Examples of quantities are: • Distance – the amount of space between two points (length, width, height). For example, the distance from your head to the floor. • Mass – the amount of molecules in an object. You know this better as weight. For example, the amount of a chemical you need for an experiment. • Volume – the amount of space an object or substance occupies, usually liquids and gases. For example, how much space air takes up in a balloon. • Time – the length of time an event takes. For example, the time it takes to run 1 mile. • Temperature – the speed of molecules in a substance. You know this better as how hot/cold something is. For example, the temperature of boiling water is 100° C.
Units 2 All measurements have units… Units are a portion of a whole/individual thing, and always have the identical dimension. • By having everybody use the same units of measurement, we can all understand what each of us is talking about… • If I say to cut a piece of wood 12 inches long, we all understand and know what that means. All our pieces will have the same length! • Units give a sense of dimension. If I say my sister is 6, it might mean six years, six months or even 6 minutes old!!! • Units can be converted into one another. For example, 2.54 centimeters = 1 inch,60 seconds = 1 minute and so on… IN ALL SCIENCE MEASUREMENTS, WE WILL USE THE METRIC UNITS, NEVER EVER THE “CUSTOMARY UNITS” LIKE HERE IN THE US! • Why? Because most of the world uses the metric system, and converting from on unit to another in the metric system is very easy!!
Distance 3 Distance is the amount of space between any two points (length, width, height). • The base units we use for distance are meters (m). • Meters can be divided into the smaller units centimeters (cm) and millimeters (mm). Meters can be combined into the larger unit called kilometers (km). • In one meter, there are 100 cm (just like there are 100 cents in a dollar) • In one meter, there are 1000 mm • There are 1000 meters in one km • The tool/device used to measure distance we will use is the meter stick. Of course, other devices are possible (e.g. ruler, tape measure). • To use, simply place the ruler at one point and count the number of cm or mm to the other point.
Mass 4 Mass is the amount of matter (molecules) in an object. You are more familiar with the term weight. • The base units we use for mass are grams (g). • Grams can be divided into smaller units called milligrams (mg). Grams can be combined into larger units called kilograms (kg). • In one gram, there are 1000 mg. There are 1000 g in one kilogram. • The tool/device used to measure mass is the scale or balance. We use 2 kinds of balances… Electronic balance Triple beam balance
Volume 5 Volume is the amount of space an object takes up. The object or substance is usually a liquid or gas, but can also be a solid. • The base units we use for volume are liters (L). Liters can be divided into smaller units called milliliters (mL). • In one liter, there are 1000 mL. The tool/device we use to find volume is called a graduated cylinder. Here is a 100 mL graduated cylinder. • The graduated cylinder has markings on the side that tell how many milliliters you are measuring. • To read the volume, you must look where the bottom of the liquid level comes. • Notice an object placed in the water displaces the water. We can use that to find the volume of the object!
Time 6 Time is the duration of an event. • The base units for time are minutes. Of course, minutes can be divided into smaller units called seconds. There are 60 seconds in 1 minute. • Other units for time include hours, days, weeks, months, years… • Note that the units for time are EXACTLY the same in the metric system as they are in the customary system in the used in the US. • We will usually use a stopwatch for most of the timing we do, but we can also use a clock, or simply count days.
Temperature 7 Temperature is the speed of the molecules in a substance. But we don’t usually think about it like that. We usually think about how hot or cold an object or substance is. • The units for temperature are degrees Celsius (°C), NEVER Fahrenheit!! • The tool or device we use is a thermometer. There are many types of thermometers, some simple, others fancy! • There are some VERY, VERY important temperatures you should memorize for science… • Freezing point of water is 0° C • Boiling point of water is 100° C • Room temperature (r.t.) is about 20° C • Human body temperature is 37° C
Making a Good Data Table 8 Independent variable in a column on the left with the changes named, with units Dependent variable in a row across the rest of the table with units Trials in a row under the dependent variable Data tables are charts that organize ALL your data in a simple, organized and easy to read way… • Data tables have certain “parts” that allow you to organize data. Data in organized into columns and rows that are clearly labeled. Data clearly listed. An average is sometimes included. You do not need units after every number!!
Graphs 9 Graphs are picture versions of number data. They are very useful to show either patterns or trends that might not be apparent just by looking at numerical data. You will see 3 main types of graphs in science and math during the year. Each type of graph is better suited for comparing different data. Bar Graphs: good for comparing many different groups/things to each other
Types of Graphs 10 Line Graphs: good for comparing how things change as others change, especially over time Pie/circle Graphs: good for comparing proportions of things to each other, or to the whole
Drawing Bar Graphs 11 bars labels labels scales • All graphs have certain “parts” that must be present and correct to make the graph readable and useful… • Some other parts of a graph like the title and key are good to have, but don’t have to be present to be correct.
Drawing Graphs - Bar Graphs 12 y-axis x-axis Imagine you want to know how the amount of food (grams) affects the height plants will grow… • Start with two axes, x-axis (horizontal) and the y-axis (vertical) • Label each axis! The independent variable usually goes on the x-axis. • Dependent variable usually goes on the y-axis. Height (cm) • Don’t forget the units for both variables! Amount of food (g)
Drawing Bar Graphs 13 60 50 Height (cm) 40 30 20 10 0 2 3 1 Amount of Food (g) • Draw scales: find the largest value in your data (52 is the largest value). Then pick a whole number close to that. For example, you might pick 60 as the number at the top of the scale. • Decide on intervals: what will you count by? Pick something you can plot easily (intervals of 10, maybe 5… But intervals of 2 doesn’t make sense). • Doing this uses the whole space of the graph, makes it easy to read and looks nice!
Drawing Bar Graphs 14 60 52 50 Height (cm) 40 29 30 17 20 10 0 2 3 1 Amount of Food (g) • Draw the bars: put bar values in or above the bar in case there is some confusion about what you mean (very helpful). • Don’t waste time coloring in the bars - not necessary! Grams of Food vs. Plant Height • Title: best is simple [Independent] vs. [Dependent]. In this case, Grams of Food vs. Plant Height.
Drawing Line Graphs 15 • In line graphs, we use a grid instead of 2 axes, but you still must label the x-axis (independent variable) and y-axis (dependent variable). • Now create the scales as before. Notice that the grid helps predict what intervals we could count by (there are 12 vertical lines and 14 horizontal lines). Your scale should take up the whole space. Average Temperature (°C) Month
Drawing Line Graphs 16 Average Temp (°C) Month • Plot the coordinates by finding where the x and y axis intersect (meet). Once all the points are plotted, you can connect the dots to get smooth curve.
Identifying Patterns & Trends 17 In this line graph, as time increases, the number of bacteria also increases. Although it is a bit harder to see, in this bar graph, as speed increases, the distance also increases. When looking at your data and graph, we can often find a pattern that describes how making a change in one variable affects another variable. • When you see that pattern, make a statement that describes how one change affects another. For example:
Identifying Patterns & Trends 18 19 28 40 Tons of Food Produced See if you can figure these out… In this experiment, as time increases, the temperature decreases. In this experiment, as the amount of food increases, the number of people decreases.
Identifying Patterns & Trends 19 Time it Takes to Fall to ground (seconds) Mass of an Object (g) Age (years) Pulse Rate (bpm) Sometimes the relationship is not clear… You can say this one a couple of ways… …There is no relationship between the mass of an object and the time takes to fall to the ground. …As the mass of an object increases, the time it takes to fall remains the same The data in this graph is all over the place!! There is no clear relationship between pulse rate and age.