Download
1 / 51
510 likes | 683 Vues
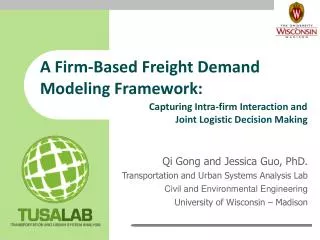
ODOT Freight Modeling. Presented to the Ohio Conference on Freight Toledo, OH September 18, 2007 By Gregory Giaimo, PE Ohio Department of Transportation. Context of Freight Modeling at State DOT’s. Part of a larger statewide passenger and freight model

E N D
ODOT Freight Modeling Presented to the Ohio Conference on Freight Toledo, OH September 18, 2007 By Gregory Giaimo, PE Ohio Department of Transportation
Context of Freight Modeling at State DOT’s • Part of a larger statewide passenger and freight model • Developed primarily to study intercity highway corridors • Prior to 1990’s, very few such models due to lack of computers and methods • Since then about half the states have developed or are developing models
Statewide Model Status Source: NCHRP Synthesis 358, Statewide Travel Forecasting Models
Freight Model Types • Freight modeling is handled in one of four ways by state DOT models • None • Traditional “4 Step” Techniques • Commodity Based • Integrated Land Use/ Economic/ Commodity Based
Source: TRB Electronic Circular E-C075: Statewide Travel Demand Modeling – A Peer Exchange
Statewide Models with No Freight Component • Some small states have models exactly analogous to urban passenger travel demand models with no freight model
Commodity Based Models • This approach models commodity flows • These flows are then converted to trucks, trains etc., generally using static mode and payload factors by commodity • This is the most common approach
Commodity Based Models (cont.) • Obtain their commodity flow data from the Commodity Flow Survey or the Transearch database • The Vehicle Inventory and Use survey is often used to develop payload factors
Integrated Land Use/ Economic/ Commodity Models • This approach also models commodity flows • The main difference from the previous type is the explicit econometric and land use models which feed commodity flows to the transport models • Thus base year commodity flows are used to estimate these economic models instead of as direct model inputs
Ohio Model • The five components directly related to the creation of freight flows will be hi-lighted: • Interregional Economic Model • Land Use Model • Activity Allocation Model • Aggregate Commercial Vehicle Model • Disaggregate Commercial Vehicle Model
Ohio Integrated Land Use/Economic/Transport Model Interregional Economic Model Aggregate Demographic Model Activity Allocation Model Land Development Model Disaggregate Household Synthesis and Employment Spatial Disaggregation Models Aggregate Commercial Vehicle Model Disaggregate Commercial Vehicle Model Short Distance Travel Model Long Distance Travel Model Visitor Model Assignment Model
Model Modules • Interregional economic modelof production & consumption by economic sector reflecting national forecasts • Demographic model tied to economic activity reflecting migration and changes in population & household composition • Activity allocation model to distribute model area economic and demographic forecasts to analysis zones with the related flows of goods & labor among zones from which travel demands are derived • Land development model simulating developer behavior in response to demands & costs consistent with other development constraints • Personal & household travel model reflecting person & household characteristics, zonal characteristics, inter-zonal economic flows & transport system supply characteristics, 2 components: short distance which looks like an activity/tour based urban area model and long distance, also tour based with purposes: business, recreation, other
Model Modules • Aggregate model of goods and services transport arising from economic and demographic activity by zone very similar to the typical DOT commodity based transport model • Disaggregate model of business-related person travel related to management functions, sales & support activities, provision of services and some short distance goods delivery. • Model of visitor travel within and into the model area made by non-residents • Transport system supply model incorporating air, intercity bus/rail, MPO transit & roadway networks with their corresponding level-of-service characteristics
Interregional Economic Model • Establishes forecast flows of goods, services and labor (in $) between 14 regions of North America • Uses exogenous national economic conditions and production composite utilities from the previous time step of the lower level models • An inter-regional social accounting matrix based primarily upon IMPLAN data
Exogenous Economic Indicators Nation Economic Forecast Variables National Economic Growth
Industry Categories 1. Agriculture, Forestry, Fisheries 2. Primary Metals (Steel)3. Light Industry4. Heavy Industry5. Transportation Equipment (Auto)6. Wholesale7. Retail8. Hotel9. Construction10. Health11. Transportation Handling12. Utilities13. Other Services14. Grade School Education15. Post-Secondary Education16. Government
Land Use Model • Creates developed floor space by category by zone • Land develops (if possible) in response to increases in households and employment in the previous analysis year (see activity allocation model) but also due to: • Zoning • Flood plains • Slopes • School district quality
Activity Allocation Model • Subdivides activity to 5000 traffic analysis zones • Population • Employment • Labor Flow • Commodity Flow • Uses transport utility equations relying on accessibilities and changes in developed land to redistribute activities from year to year
Activity Allocation Model • Inputs include: • Regional flows from Interregional Economic Model • Floor space by category by TAZ from Land Use Model • Households from Aggregate Demographic Model • Transport costs from previous iteration of Transport Models
Aggregate Commercial Vehicle Model • With the commodity flows established, the aggregate commercial vehicle model itself is very similar to the commodity representation in other statewide models • Input is dollars of flow of goods and labor at the Traffic Analysis Zone (TAZ) level • Output is flows of trucks between TAZ’s
Aggregate Commercial Vehicle Model Flow Chart Fixed shares by commodity class, by distance for bulk commodities, mode choice model for inter-modal eligible commodities, based on CFS Total Dollars flows Determine Mode Convert Goods Flows to Tons By commodity class and distance, from CFS By commodity class and distance, from VIUS Determine Truck Type Determine Number of Truck Loads By commodity class and truck type, from VIUS Based on traffic counts, conversion from annual to weekday assumes 300 equivalent week days per year. This value is obtained as follows: (52 * 5) weekdays plus (52 * 2 * 0.44) weekday equivalents for weekends minus 6 holidays. Determine Trucks by Hour of Day Trucks by type by hour by OD TAZ
Disaggregate Commercial Vehicle Model • DCOM is designed to account for short distance commercial travel not related to the long distance shipping of freight (accounted for in ACOM) • Long distance business travel is accounted for in the Long Distance Travel model of the personal transport model since these trips were obtained in the special long distance travel survey
Disaggregate Commercial Vehicle Model • Employs a tour based microsimulation of employees • Based on establishment surveys • Analogous to HH based tour based model but based at the place of work • Does not include route delivery vehicles
Disaggregate Commercial Vehicle Model Employment categorized as: • Industrial • Wholesale • Retail • Transportation Handling • Service
Disaggregate Commercial Vehicle Model Trip purposes: • Service • Meeting • Goods (delivery) • Other (includes such things as stopping for lunch or fuel)
Traffic Flow Maps District 2 Volumes Excluding Interstate District 2 Volumes Including Interstate
Toll Sensitivity Analysis Showing Volumes Changes
Congestion Management Congestion Comparisons By ODOT Districts For Ohio Counties
Future Challenges • Modeling community would like to move to more detailed freight modeling based upon econometrics and supply chains • The main challenge that plagues this as well as current modeling efforts is the lack of geographically specific freight data
Top 10 Challenges Impeding Development of Freight Models by State DOT’s • Lack of DATA • Lack of DATA • Lack of DATA • Lack of DATA • Lack of DATA • Lack of DATA • Lack of DATA • Lack of DATA • Lack of Money • Lack of better theoretical formulations (but see 1-8 for why this is the case)