1 / 0

Supply Chain Training for Non-Supply Chain Professionals Revision 1

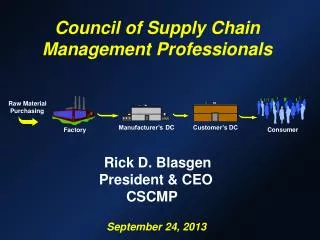
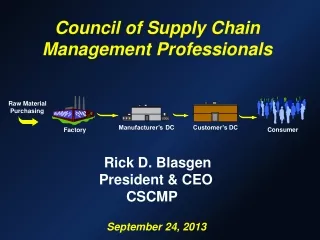
Supply Chain Training for Non-Supply Chain Professionals Revision 1. Agenda. Objectives The Goal of a Process The Forecasting Process The Supply Chain Process Demand Planning and some goofy baby pictures at the end in a bonus section

rey
Télécharger la présentation

Supply Chain Training for Non-Supply Chain Professionals Revision 1

An Image/Link below is provided (as is) to download presentation Download Policy: Content on the Website is provided to you AS IS for your information and personal use and may not be sold / licensed / shared on other websites without getting consent from its author. Content is provided to you AS IS for your information and personal use only. Download presentation by click this link. While downloading, if for some reason you are not able to download a presentation, the publisher may have deleted the file from their server. During download, if you can't get a presentation, the file might be deleted by the publisher.

E N D

Presentation Transcript


  1. Supply Chain Training for Non-Supply Chain ProfessionalsRevision 1

  2. Agenda Objectives The Goal of a Process The Forecasting Process The Supply Chain Process Demand Planning and some goofy baby pictures at the end in a bonus section Note: this is all my work and shows no confidential information from any company I have worked at, so I saved it as a power point. This allows you to customize it however you want. It would be great if you kept the website’s name on at least part of it, or credited it somehow, and begged them all to visit my site since I need the traffic. My mom is getting tired of logging on everyday to drive the illusion of visitors, so we need some help here people. Do it for my mom.
  3. Goals and Objectives Emphasize the critical role of Forecasting Provide a basic understanding of Supply Chain Planning for Non-Supply Chain professionals. Improve Collaboration across the Value Stream (eliminate the business silos). Demonstrate some basic tools in SAP. Identify the processes that help or hinder us.
  4. What is a Process?Jim Womack is a famous Lean Thinker, and here are some of his thoughts on Lean and Processes. It always begins with the customer. The customer wants value: the right good or service at the right time, place, and price, with perfect quality. Value in any activity – goods, services, or some combination -- is always the end result of a process (design, manufacture, and service for external customers, and business processes for internal customers.) Every process consists of a series of steps that need be taken properly in the proper sequence at the proper time. To maximize customer value, these steps must be taken with zero waste.  (I trust you know the seven wastes of overproduction, waiting, excess conveyance, extra processing, excessive inventory, unnecessary motion, and defects requiring rework or scrap.) To achieve zero waste, every step in a value-creating process must be valuable, capable, available, adequate, and flexible, and the steps must flow smoothly and quickly from one to the next at the pull of the downstream customer.  (This is how we eliminate the seven wastes identified by Toyota many years ago.) A truly lean process is a perfect process: perfectly satisfying the customer’s desire for value with zero waste. None of us have ever seen a perfect process nor will most of us ever see one. 
  5. It always begins with the customer.The customer wants value: the right good or service at the right time, place, and price, with perfect quality. Cake and Brownie Company Products provide good value in the market place. Delivering them seems to be a significant issue at times. Key Questions to answer each month are Forecast Questions - What, How Many, and When
  6. So How do we do this?How do we deliver the correct product, in the right Quantity, at the right time? Value in any activity – goods, services, or some combination -- is always the end result of a process (design, manufacture, and service for external customers, and business processes for internal customers.) Every process consists of a series of steps that need be taken properly in the proper sequence at the proper time. None of us have ever seen a perfect process nor will most of us ever see one.  If Forecasting is to be a value added activity, it has to be part of a process
  7. Forecasting and Planning in Real LifeUn-forecasted Demand Suppose you meet 6 hungry sailors at the mall, and bring them home to dinner that night. If your spouse is cooking that night, and you don’t tell your spouse, what happens? Is the un-forecasted demand a good thing or a bad thing? How is your home life?
  8. Forecasting Demand for Dinner After you’ve recovered and are ready to invite some more new friends over, you might start to use a forecasting process. At the next party, you invite exactly 7 new friends. You buy the drinks and salad, and exactly the right amount of steaks, plus an extra couple just in case (a little safety stock never hurt anything). The steaks are grilled to perfection….
  9. Mix matters… Your seven new friends show up and you introduce them to your spouse who points out… They are all Hindus and none of them eat steak… Hmmmm…
  10. Mix Matters… You got the exact quantity correct, but you forecasted the wrong meal… You have hungry guests, and too much food (service and inventory are both out of control…) And by the way …How is your home life?
  11. Forecasting & the Planning Process It always starts with Forecast. The Forecasting Process at Cake and Brownie Company involves taking the SAP trended data, and working with Sales and Marketing to validate the data. After input into SAP, it drives the purchase and manufacture of products to meet our customers needs. Key Elements of the forecast are what finished goods are needed, how many units are needed, and when (What, How much, and When). If we get these elements wrong, we will get service and inventory wrong.
  12. Flexible Planning and MRP Supply Chain enters the Forecast into the Forecast Tool (currently Flexible Planning) The Forecast is reviewed as part of the SIOP Process After review and agreement, Flexible Planning takes forecasted demand for a SKU and passes it over to a software system - Materials Requirements Planning (MRP). MRP looks at forecast, then it looks at Inventory, and then decides what has to be made to cover any gap between Forecast and inventory. MRP generates Action messages – it tells planners what it thinks they should do – “Buy me” or “Make me” or “stop buying me” and “stop making me”.
  13. MRP MRP means Materials Requirements Planning This systems drives the plan to buy or make enough components to cover forecast demand. If there is enough inventory to cover forecast we don’t have to make or buy anything. In order to work, Bills of Materials, Purchase plans, and other data points must be set up, or we will not know what to make or buy. MRP always wants to perfectly balance Forecast with purchase/production, so always wants to end in zero inventory. MRP requirements are a calculation based on the forecasted quantity - I forecast 1 car, therefore I calculate I need 4 tires.
  14. Materials Requirements Planning is Easy Math you too can be a planner! Do you remember those “solve for x” problems in school? That’s MRP! Assume you have a forecast for 100 units, and 50 units in inventory. How much do we need to make or buy? 100 = 50 + x, solve for x X = 50, so you make or buy 50 units Forecast = Production + Inventory Production = Forecast - Inventory
  15. MRP Examples – simple math Let’s say you have a forecast to sell 100 Units in Demand Solutions. What does MRP do with it? Forecast = Productions Orders + Inventory Note the 3 scenarios below – In each scenario, the combination of inventory plus Production covers the forecast
  16. Planning in Real Life (Part I)You want your Supper? When? In real life, if we want Fried Chicken at 6 PM, when should we start cooking? Most of us might start at 5 PM to get dinner ready. This is our dinner time fence – the latest we could start, and have dinner on time. Time Fences tell us when we should start something to complete it on time. Note - You cannot fry the chicken at twice the heat and expect the same results!
  17. Planning in Real Life (Part II)Getting to work on time Some of us need to get to work on time everyday. One trick is to set the alarm clock ahead by 15 minutes, and fool yourself into getting up 15 minutes early. This is a Safety Lead time
  18. Time itself doesn’t change or increase, but the setting on our clocks changes, and that changes how we react in the morning We are building in a safety stock of time so we don’t have to run around in the morning. Planners do the same thing with a system setting called safety lead time. Safety lead times settings cause us to order inventory earlier than we might normally.
  19. Safety Stock – Fixed Quantity Can I create a false negative in a checkbook? Set it up so I show negative when we actually have $500? If I overspend by $400 one week, my safety stock saves my balance. What happens if I overspend every week? I thought we had safety stock....
  20. Coverage Profile Coverage Profile is a Dynamic Safety stock. A Coverage Profile of 5 days will try and always drive the system to make an extra five days of forecast. Because it is dynamic, it will want more safety stock when Forecast is high, and less when forecast is low.
  21. Safety Stock does NOT guarantee Inventory is always available. Safety Stocks are settings in the system. It is usually calculated and statistically derived. It is not product hidden away in a guarded vault. Safety Stock causes us to have more product than the forecast would normally drive. If Demand is higher than forecasted, or if supply takes longer than the system is set to believe, we could stock out. It prevents some stock outs, but may only delays others, depending on the size of the demand or supply swing.
  22. Time Fences on products Imported hand tools may have 10 to 12 weeks lead times. This means forecast typically needs to be in the system and product ordered 10 to 12 weeks before the anticipated customer requirements. To receive product for shipment on October 1st, we should order it by July 1 to July 15th. The Timbuktu and Keebler Elf Tree Factories are one week due to proximity to the DC, but component lead times can be much longer. The size of a change in orders can affect lead-times.
  23. How do Time Fences, MRP, and Forecast affect each other? Why do they matter? Production and Purchase Orders are created based on needs in the system driven by forecast. Production and purchase orders are released at the Time Fence. The Time Fence is based on Lead times. If it takes 10 weeks to get a product, an order will be suggested by MRP based on forecast, 10 weeks prior to the need date. Forecast for the current month drops off after the month is done. It no longer is in the system driving production/purchase orders. Where this gets a little tricky is when the forecast for a current month drops off and the current month was “unique” to the following months. For example, if it is a roll-out month and the roll-out does not occur, forecast drops off, and does not drive the roll-out orders.
  24. MRP Example 1 – Demand over forecast In this example, Demand exceeds Forecast by 50% (50 Units). Since we react instantly, because we have POS or some data like that, we make the adjustment to forecast at the Time Fence. We stock out in June, but recover in July Note the size change in the production plan in Asia Note that what we know in April, impacts July
  25. MRP Example 2 - Demand Under Forecast In this example, Demand is under Forecast by 50% (50 Units). Since we react instantly, because we have POS or some data like that, we make the adjustment to forecast at the Time Fence. We zero out all orders from July to the end of the year. We end the year with 3 months inventory Note the Production Plan in Asia A key point about MRP – since we have inventory to cover Forecast, Forecast does not drive production (“solve for x”)
  26. MRP Example 3 and 4- Demand 100% 0ver forecast, and 20% of original Forecast Note Part C has sizable shortages/service issues. Note Part D has sizable inventory stranded.
  27. How about a combined view of the four examples? When we combine the four examples, we notice that the original aggregate fore cast of 400 total units each month is close to actual demand of 420. But look below at the production plan. Note the spikes. Also, note the inventory level is above target. Both add cost.
  28. Over forecasting and not deleting unconsumed
  29. Under forecasting and not deleting unconsumed is not really an issue
  30. Under forecasted but with 2 week lead time spikes the production plan at the plant – it does not spike the forecast, but does spike demand by creating an STO reflecting additional demand
  31. Backward/Forward Consumption ScenariosThe first circled area shows that the actual order for 20, after weeks with no orders, consumes the current week and then backwards.The second bubble shows forward consumption of forecast
  32. So does Forecast matter? Forecast drives both Customer service and inventory levels. Supply Chain follows a system driven process which needs to be set up correctly and on time. We can have bad service and bad inventory levels, with even small “aggregate” levels changes in demand. What, How much, and when are the critical questions! Always, always let your forecast analyst know when things are changing
  33. Bonus Round – SAP that will help you Business Warehouse – service and sales reports MC.9 - inventory MD04 – the Plan MD07 – red lights, green lights MB51 – shipments VA05 – display Customer orders
  34. Questions? Topics we missed? Feedback? Does this add value or not? If it adds value, who are the target audiences?
  35. Bonus Slides Here I was trying to slam together something on Demand Planning, and it did not work well, but there is still some fun material you can move around
  36. Bite Sized NuggetsPresents a case study:Demand Planning 101 at an unknown Fruitcake Company

  37. Agenda It’s hidden, so proceed at your own risk. It is also true that companies face the same issues, over and over, because very few have exceptional processes or leaders. Bite sized nuggets is an effort to explain in short, incomplete, and maybe incoherent presentations certain aspects of supply chain. We keep them short, incomplete, and possibly incoherent so they are suitable for all audiences, especially executives. Enjoy! Or not, I do not care that much either way.
  38. The actual case This company did not understand a few things . the limits of statistical forecasting, especially in highly variable environments (engineer to order, highly seasonal, some consumer products) Failure to understand the coefficient of variation on demand has many companies trying to forecast that which cannot be forecasted (a Voldemort forecast if you will) The need for S&OP to have a top level champion who is really engaged, and not just calling it a priority and delegating it. They also failed to recognize many of the processes they were trying to create already existed, so they built less perfect redundant processes that lost the audience while adding meetings and work. This company also made the process so complex and detailed that only the S&OP department understood it, and thus it never gained any real traction
  39. S&OP “Gaps” We are not successful with our S&OP Process (we being most companies and the reason you are here reading this). What are our Recurring “Gaps”? Translation of the forecast into units and how it impacts the Demand Review Inflated view of revenue as incremental demand is added to a statistical forecast that includes non-recurring events (prior projects) Sequence/Timing of Meetings gets disrupted while trying to fix translation
  40. The Translation Gap The dollarized view of demand has been difficult for the Demand Solutions System to convert into units. The problem gets worse when we have a high % of buy-outs in the mix The business is trending more towards buy-outs, while staying relatively flat on capacitor units Errors have included Line item quantity vs. capacitor units Venezuela Order converted to 40,000 Brownies, not 3,200 in the December cycle Demand review $ higher than plan due to projects being added to a statistical base that is inflated by prior years non-recurring events
  41. What we know about units Naughties Fruities Creamie High COV is tough to forecast statistically Fruities Creamie Naughties 41 Standard units have a low coefficient of variation and are typically US customers. International Projects tend to be the focus of the pre-demand review and typically are internally fused or extra large units Internally fused and extra large units have high demand variability
  42. Generating a “flat” MRP demand plan For Naughtie Brownies units, the proposal is to take the statistically generated demand plan On a 240 day year, this would be approximately 300 units a day For Fruitie Brownies, the proposal is to load a flat forecast of 30 units a day (7,000 a year) This will give us some “pipeline” materials It may lead to “heavier inventories at times It does not guarantee we can make any given rate at any given time It will have to be managed up or down based on the data from the demand review Major expected changes would be added incrementally to the base forecast For Creamies, the proposal is to load a flat forecast of 30 units a day (7,000 a year) The same logic applies as above for Fruities.
  43. Getting MRP Less Wrong No shortages! Level loads! Zero inventory! HAPPY BABY! On flat demand we should get the components in time to make the parts in time and to get to MRP’s goal of zero inventory with perfect service
  44. Lumpy Demand Excess Inventory Demand but no parts to produce With Lumpy demand, we need to bump forecast on Fruities and extra Creamies to avoid the following conditions Excess Inventory No enough inventory (airfreight) Production stops Sad Babies
  45. Dollarized Demand The Proposal is to take current update for the quarter, and then to stick to the budget numbers for dollars, unless there is a change up or down, or recovery plans for gaps.
  46. Sequencing of Meetings When we have gaps, gaps should be noted and the other meetings should continue as Planned unless the team sees the gap as a “show stopper”. Plans to close gaps or correct errors should be forwarded through the meeting cycle. The rationale is that a gap on an internally fused demand plan should not cause supply discussion on metal enclosed banks or the Brazil start up to stop.
  47. Other Meetings Most companies have a core competency centered around too many e-mails, too many meetings, and too much redundant information. Whenever we refer to other meetings, be advised that adding a meeting where one may already exist is never a good idea. Find one that sounds like it is about sales or demand planning, and see what is going on before assuming you need to “add”. There are pretty good arguments for not layering S&OP on existing meeting schedules, and keeping it separate. My only general comment here is that if S&OP is being done at a high level, and has not degenerated into a middle management cattle call, this maybe true. I also continue to be suspicious of large Power Point Decks, and poorly understood metrics or statistical data that is not infomrative.
More Related