Download
1 / 24
240 likes | 378 Vues
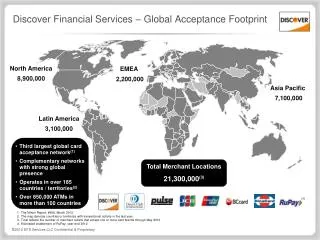
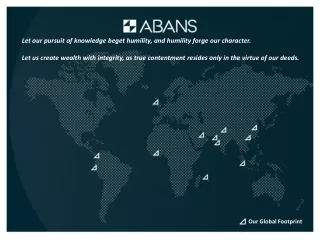
Oerlikon Solar . Global Footprint and Growing. Oerlikon Drive Systems. Oerlikon Components. Oerlikon Vacuum. Oerlikon Textile. Oerlikon Coating. North America Sales Customer Support Operations ( est. 2009). Europe Solar HQ Operations Pilot Line Advanced R&D

E N D
Oerlikon Solar Global Footprint and Growing Oerlikon Drive Systems Oerlikon Components Oerlikon Vacuum Oerlikon Textile Oerlikon Coating • North America • Sales • Customer Support • Operations (est.2009) • Europe • Solar HQ • Operations • Pilot Line • Advanced R&D • Product Development • Customer Support & Training • Asia • Sales • Operations • Pilot Line • Technology Center • Customer Support & Training
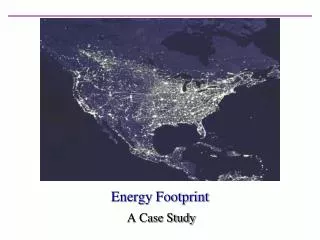
Intense energy consumption of conventional sources drives CO2 emission Energy consumption, particularly power generation, is responsible for CO2 emissions “Energy production is – by far - the most important driver for emissions of greenhouse gases.” STERN REVIEW: The Economics of Climate Change “In 2030, global CO2 emissions will be 70% more than today … and power generation will account for almost half the increase.” International Energy Agency: Emissions report Source: Stern Review “The Economics of Climate Change”; IEA
CO2 emissions and concentration in the atmosphere have been rising substantially in the last ~50 years CO2 concentration in atmosphere (in ppm) CO2 emissions from fossil fuels(in M t/year) CO2 concentration in atmosphere Carbon emissions from fossil fuels Pre-industrial CO2 level Source: CO2 concentration: C.D. Keeling, T.P. Whorf et. Al., “Air samples collected at Mauna Loa Observatory Hawaii”; CO2 emissions: G. Marland, B. Andres, T. Boden, “Global emissions from fossil burning”
CO2 concentration in atmosphere responsible for global warming and climate change Upsala Glacier, Arg: Once the biggest in South America, now disappearing at a rate of 200m per year 1928 “According to relevant scientific contributors manmade emissions of carbon dioxide (CO2) are driving … global climate to unprecedentedly warmer temperatures” IPCC: Survey of IPCC Climate Experts “According to relevant scientific contributors manmade emissions of carbon dioxide (CO2) are driving … global climate to unprecedentedly warmer temperatures.” IPCC: Survey of IPCC Climate Experts 2004 “… emissions of carbon dioxide (CO2), the main gas responsible for climate change, as well as of other 'greenhouse' gases …” European Commission's Climate Change Campaign Source: IPCC, European Commission
… consequently, the Fossil Fuel Era will be over soon Illustration of Fossil Fuel Era Corresponding facts • Fossil fuel created:Within the last 600 Million years • Mankind on earth:250,000 years • Fossil Fuel Era:300 years (1800 – 2100 AD) Energy (fossil sources) for mankind Years AD 0 500 1000 1500 2000 2500 3000 Renewables Fossil Fuel Era ? Source: Litsearch
Global Energy Supply until 2100 Source: solarwirtschaft.de
Solar PV enables multiple applications Grid-connected Off-grid Distributed Centralized Domestic Non-domestic • Residential roof-top • Commercial roof-top • BIPV (building integrated PV) • Power plant/ solar park (Ground-mounted systems, mounting may include tracking) • Roof-top or BIPV installations in villages for public and private buildings • Rural (e.g., water pump) • Ubiquitous consumer products(e.g., clothing) • Space/ high value (e.g., satellites) Source: IEA, Sarasin; Expert Interviews; Oerlikon analysis
Two major technologies within Solar PV: the established bulk crystalline silicon cells and thin film as challenger Solar modules based on crystalline silicon Solar modules based on thin film depositions • Production: • Solar modules produced on the basis of a (crystalline silicon) wafer • Cell functionality, e.g. contacts for electricity extraction, applied onto crystalline wafer • Economic & ecologic characteristics: • Current silicon shortage makes production significantly more expensive • Relatively high (vs. thin film) CO2 emissions during production due to higher raw material intensity • Production: • Modules produced via deposition of very thin films onto a glass substrate • Cell functionality, e.g. contacts, also deposited via thin transparent films • Economic & ecologic characteristics: • Lower module production costs and CO2 emissions due to better raw material efficiency • Competition of several technologies (e.g., Silicon thin fim, CdTe, CIS/ CIGS) additional driver for cost reductions Market share decreasing Market share increasing Source: Industry Reports; Litsearch
Installed production capacity / Solar Revenue goals* Oerlikon Solar growth outpaces the photovoltaic market (million CHF) >1.000 250 Ø growth rate 2006-2015 Thin film 74.8% Crystalline Si 49.4% Total market 54.0% 200 >700 150 GWp 100 >300 >140 50 0 2006 2007 2008 2009 2010 2011 2012 2013 2014 2015 Crystalline silicon Thin film *Revenues 06-07 pro forma, Solar as stand-alone segment from 08
Primary Production Technologies for Solar Cells Technology Substrate Cell Issues Cost Silicon Supply Crystalline Silicon Thin Films Large Scale Mfg. Efficiency
Glass Front Contact Thin Films PV Material Back Contact Lamination Glass Thin Film Solar Cell Basics Manufacturing Order Thin Film Solar Cell Structure Thin Film Solar Panels
Laser Scribers Define Cells Key process elements needed for scalable Thin Film PV Manufacturing PECVD Deposit PV Material LPCVD Deposit Contacts
Best Commercial TCO Oerlikon TCO a-Si:H mc-Si:H Micromorph Process Technology– up to 50% more Efficiency The principle of light trapping to deliver high performance TCO Visible Near IR Amorph Micromorph Tandem • The goal is to optimize the haze • to better the performance. • Integral to Micromorph process • -High transmission in visible and near IR light spectrums a-Si/ µ-Si
Oerlikon is the leading supplier of silicon thin film turnkey solutions Source: Oerlikon
TCO TCO back contact TCO: Transparent Conductive Oxides Clean Laser PECVD Laser Laser Assembly TCO 1200 – Proprietary TCO Enables Higher Efficiency TCO TCO
The principle of light trapping • Haze 10-25% • T400-800 93% • T400-1100 92% • Rs <10 Ohm Clean Laser PECVD Laser Laser Assembly TCO 1200 – Proprietary TCO Enables Higher Efficiency TCO TCO
amorph micromorph 0.3 µm 2 µm Clean TCO Laser Laser TCO Laser Assembly KAI 1200 – Proven Technology for PV Layers • Plasma Box® for single reactor processing • 40 MHz for increased deposition rates • Parallel processing (20 reactors) and load lock for high throughput PECVD
Pattern 3 Pattern 2 Pattern 1 Glass TCO a-Si:H Back Contact (TCO) Clean TCO PECVD TCO Assembly LSS 1200: Key to Efficiency and Reproducibility • The only system qualified for • mass production • all 3 laser scribing patterns Laser Laser Laser Pattern 1 Pattern 2 Pattern 3
Clean TCO PECVD TCO Assembly LSS 1200: Key to Efficiency and Reproducibility • The only system qualified for • mass production • all 3 laser scribing patterns Laser Laser Laser Pattern 1 Pattern 2 Pattern 3
It’s All About Lowering Cost per Watt to Reach Grid Parity Total Cost Throughput x Power $ Wp = Micromorph High Efficiency Tandem Solar Cells Turnkey Advanced Manufacturing Lines Oerlikon Advantage
Cost of Ownership Development to Grid Parity Thin Film Si Roadmap 100% 2010 for GWp campuses < 0.7 $/Wp (<0.52€*/Wp) 80 2007 for 20 MWp fabs < 1.5 $/Wp (<1.12€*/Wp) 60 40 20 0 Current Equipment Material Other Tact Cell Economies 2010 small cost cost cost time efficiency of scale large fabs decrease decrease decrease decrease increase fabs *exchange rate 1€ = 1.34$
Achieving Grid Parity Fab nominal capacity Module efficiency GW/p 13% 12% 1 11% 0.3 10% capacity 0.12 9% 0.08 8% Next Generation Thin-Film 0.04 MicromorphTandem 7% Amorph 2006 2007 2008 2009 2010 2011 2012 2006 2007 2008 2009 2010 2011 2012 CapEx per Watt Cost of ownership $/W $/Wp 1.5 4.00 3.50 Grid Parity 1.0 3.00 2.50 GigaFab 0.5 2.00 1.50 2012 2007 2008 2009 2010 2006 2012 2010 2007 2008 2009 2011 (Calculated with an exchange rate of €1.00 =$1.34)