Download
1 / 50
510 likes | 610 Vues
How utilities can leverage analytics and communications to better serve and educate customers. Jay Robinson Senior Consultant, Professional Services & Software Ricoh Production Print Solutions. Utility Payment Conference.

E N D
How utilities can leverage analytics and communications to better serve and educate customers Jay Robinson Senior Consultant, Professional Services & Software Ricoh Production Print Solutions Utility Payment Conference
“Would it be more honest—and therefore more credible—to acknowledge that electricity prices will almost certainly rise going forward and that active management, at best, can mitigate that rise? It's tempting to say customers will "save money," but if it turns out not to be true, the industry has squandered significant good will on billions of dollars of investment by customer...” - Phil Carson, Editor-in-Chief, Intelligent Utility Daily, May 7, 2012
Today’s presentation will cover: • Factors driving the imperative to better communicate with you customers • Two great strategies for addressing targeted, relevant and high rate of adoption customer communications • Predictive Marketing Analytics • Case Study #1 – NW Utility utilizing predictive analytics to achieve greater response, lower marketing costs, broader reach • Customer Statement Redesign • Case Study #2 - How the Los Angeles Department of Water and Power turned a dated, confusing billing statement into a clear, colorful and behavior modification vehicle
Now more than ever utility companies and their customers need to be in sync Volatility of pricing Environmental Concerns Evolving portfolio of energy sources Increasing costs of all services to customers and the endless drive for efficiency Increased diversification of customer base and the attendant language and technology challenges
Rapid evolution in customer communication methods and technologies • Traditional Statements Paper - complex platforms • New Channels websites, email and mobile • Education Avenues social media intersecting print, television and radio Print/Mail/Fax Web Email SMS/Voice Message Connect Records/Archive 4
Rapid evolution in customer communication methods and technologies TAKEAWAY: Complex, rigid and aging customer communications vehicles and infrastructures aren’t flexible enough to adapt to the new marketing capabilities 5
Challenges to better communication • Lot’s of data, less information, little knowledge • Inflexible legacy CIS, CRM and Print/Mail systems • Unable to accommodate evolving methodologies: “adaptive/real-time”, multi-channel, integrated, predictive and feedback driven communications • This inflexibility results in no support for new communications opportunities: • Made available by huge amounts of data from AMI/Smart Grid systems • Needed for rich customer dialogue necessary to support Demand Management Pricing
Some enabling technologies and data levers Leverage and integrate these to create and manage an adaptive, targeted customer communication strategy Customer Marketing Analytics Multi-channel communications engines Composition tools Color printing platforms Customer aggregators Workflow Managements tools Campaign management and evaluation tools Cost efficient SaaS and On-site Managed Services models
The Result: A Fully Integrated Advanced Customer Communications Infrastructure
One strategy to increase the effectiveness and broaden the reach of you customer communications is to utilize Customer Marketing Analytics
New York Times April 23, 2011 “Internet era technologies are doubling the quantity of business data every1.2 years.”
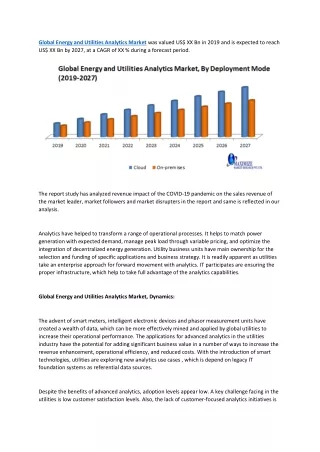
400 “The estimated number or agencies involved in managing California’s water supply. Analyzing the data they generate can make water management more effective.” *HBR November 2010
“From Start to Finish” ? ? ? ?
Your Feedback • Delinquent Accounts • Going Electronic • Service Enrollment • Call Center Activity • Green Adoption • Usage Estimations • Customer Attrition • Others ???
Key Takeaway • “We need to improve the connection with our customers.” Richard McNutt @ Southwest Gas
Today’s Questions • How do we quantify electronic vs. paper? • How can I affect ‘change management’? • How much does it cost to go from generic to specific? • How can we establish ‘proactive’ pricing vs. ‘reactive’? • In the absence of data, how can we better understand our customers? • Survey, Test, Measure
A Typical Customer Campaign • Budget for communicating to 100,000 customers • Key metrics to achieve • 1,000 new accounts • $1 million in revenue • Achieved stated objectives • Repeat campaign
Business Rules Segmentation Profiling(look a likes) Predictive Modeling(behavior based) How Analytical Are We? Analytical Continuum Low High #1 #2 #3 #4 Extensive Minimal Volume of Data
Optimizing with predictive Analytics 100,000 Mailed1,000 New Accts $1M in Revenue 95% (Results) 40% (Mailed)
Six Months Prior Current
Proper segmentation is critical Bad segmentation Good segmentation B A ? A B ? ? ? ? ? D C D C Take away: Good segmentation allows for campaign learning.
ENGAGED ELITE HIGH VOLUME ELITE HIGH VOLUME ENGAGED (LOW RISK / HIGH POTENTIAL) (HIGH RISK / HIGH POTENTIAL) OCCASIONAL CONSERVERS (HIGH RISK /LOW POTENTIAL) (LOW RISK / LOW POTENTIAL) HIGH Establishing sound portfolio segments HIGH Usage LOW Payment Risk
Engaged Elite Segment HIGH HIGH VOLUME ELITE ENGAGED ELITE OffPeak 20% • The Audience • 40,000 customers • 5% of your customer base • 25% of all your power usage • Ave kwatt usage per month: X • Product Information • Average of 4.3 services • 10% of customers have ‘Auto Pay’ • 85% of customers have ‘Even Pay’ • Average amount due= $275.00 • Average revenue = $4,000 • Demographic • Tenured customers • 9 years under current address • 35-44 age range • Home owners • Approx home value = $235,000 HIGH VOLUME ENGAGED (HIGH RISK / HIGH POTENTIAL) (LOW RISK/ HIGH POTENTIAL) UsagePotential Peak 80% OCCASIONAL ONE OFF (HIGH RISK / LOW POTENTIAL) (LOW RISK / LOW POTENTIAL) LOW HIGH Risk Potential • Sample Strategies • Quarterly Campaign: Promote incentives around ‘Auto Pay’ and ‘Even Pay’ to address delinquency issues in the portfolio • Education: Personalize your communications to this segment via portfolio analytics for improved efforts and targeted / relevant messaging
Where is your communication opportunity? Over 20,000 households that have been customers for over 1 year are single service or two service members, presenting a significant cross sell opportunity + = 20,000 # Households per Service Mix
Recap • New York Times • Quantity of business data doubling every 1.2 years • Harvard Business Review • 400 agencies involved in managing California’s water • The need to improve our connection with customers • Richard @ Southwest Gas • Enablement technologies that are available today • Analytics, Composition, Workflow, Printing, Electronic
Why you should care • Improved revenue • Decreased customer delinquency • Decreased call center activity • Improved green adoption • Improved service enrollment • Targeted customer pricing • Others
Summary of Utility Solution Set Offering A ‘behavior based’ suite of predictive models designed to optimize marketing budgets and improve how utilities communicates with their customers. 30
Campaign Selection Process Full Utility Population 500,000 If customer is in the “Frontier” segment and; 100,000 customer has an “Equal Pay” score of 1, 2 or 3 30,000 customer has a “E-Billing ” score of 1, 2 or 3 9,000 Then customer gets offer “A” 9,000 Offer “A” If customer is in the “Explorer” segment and; 85,000 customer has an “Equal Pay” score of 1, 2 or 3 25,500 customer has a “Late Pay” score of 1, 2 or 3 7,500 Then customer gets offer “B” 7,500 Offer “B” If customer is in the “Stable” segment and; 130,000 customer has an “Equal Pay” score of 1, 2 or 3 39,000 customer has a “E-Billing” score of 1, 2 or 3 11,700 Then customer gets offer “C” 11,700 Offer “C” If customer is in the “Explorer” segment and; 100,000 customer has an “Equal Pay” score of 1, 2 or 3 30,000 customer has a “Late Pay” score of 1, 2 or 3 9,000 Then customer gets offer “D” 9,000 Offer “D” 31
Deploying the solution (Segmentation & Models) Frontier Explorer Promoting Equal Pay (scores 1-3) and Electronic Billing (1-3). This group is showing propensity for signing up for more services and is a high risk from a payment perspective. Leverage the service models to further integrate and mitigate the known risk that this segment is showing. Promote Renewable Energy (scores 1-3) and improved usage (scores 1-3). This group is showing propensity for signing up for more services and is a minimal risk from a payment perspective. Leverage the service models to identify who to target with specific services. Challenger Promoting services will prove difficult in this segment. Improving clarity around billing options, call center help lines and overall content to mitigate late payer volume. Consider testing special campaigns into this group to further understand their profile and what (if anything) the utility can do to improve delinquency in this segment. 32
Case Study #1 - A Utility scoring campaigns against a predictive marketing analytics suite
Case #1 Utility Electronic Billing Campaign Validation To assess the Utility’s recent electronic billing campaign, vendor offered to score their test population as well as their full May 2011 customer population through its electronic billing solution model. The first chart illustrates the results of vendors campaign distribution. The Utility marketed to 220,634 customers. The campaign brought in 2,332 responders to the e-billing offer. Vendor took the 220,634 audience and scored this population through our e-billing solution model, as illustrated in the next chart. Had the Utility’ leveraged the predictive model we would have recommended cutting off the campaign selection at score 3. This would have enabled Utility to market to 76% of this group while capturing 86% of the responders. 34
Electronic Billing Campaign Validation In addition to this the vendor scored the full Utility’s portfolio for the May 2011 time frame. This allowed us to see who outside of this 220,634 we would have targeted with our model selecting the audience. Had the vendor leveraged its electronic billing model on the May 2011 file we would have selected 92,713 customers outside of the vendors modeling selection. This group went on to respond to the electronic billing services at a 1.51% rate, accounting for an additional 1,396 additional e-billing customers. 35
Electronic Billing Campaign Validation Represents the population predictive vendor would have selected Predictive Model Utility Model Response Rate 1.51% 92,713 Selected 1,396 Responders Response Rate 1.21% 166,676 Marketed 2,009 Responders Response Rate 0.60% 53,958 Marketed 323 Responders Represents the 220,634 that Utility model selected
Another huge opportunity to drive program adoption and lower customer service is through Statement redesign
Little known statistics… Nine out of ten consumers open monthly bills delivered via traditional mail, compared to 72 percent who open bills delivered via email The typical consumer reads a billing statement 2.3 times Source: CMO Council Research, November, 2009 Why Relevance Drives Response and Relationships: Using the Power of Precision Marketing to Better Engage Customers,
If you want customers to… Make fewer calls to your customer service Pay bills on time and migrate to more advantageous payment programs Adopt energy efficiency programs Adopt electronic communication channels Understand demand management, AMI and tiered pricing programs Have a better opinion of the Utility value; when services are affected (weather outages, etc.) they are less inclined to become angry/take action
Business Statement TransPromo Direct Marketing Combining Promotional messaging with the Transaction statement will produce greater results Targeted, relevant messages
Typical redesign utilizing this concept Before TransPromo TransPromo Statement
Case Study #2 the Los Angeles Department of Water and Power Nation's largest municipal utility, delivering water and electricity supplies to more than four million users in homes and businesses throughout the City of Los Angeles LADWP was established in 1902 to deliver water to the City of Los Angeles. Electric distribution began in 1916. The Department serves four million residents, with approximately 1.4 million electric service connections and 712,992 water service connections. Also provides billing for City sanitation services (trash and sewer)
Challenges • Dated billing statements with poor readability and use of space • Poor layout to communicate different charges leading to customer confusion and higher customer service (call center) expenses related to bill related customer inquiries • Goal to reduce customer calls by 20% • Aging infrastructure of printing hardware and software to create communications, print and mail • Effort by the Mayor, LA City Council and LADWP effort to meet and mitigate rate impacts of the State of California Carbon mandates for reducing climate change or greenhouse gas (GHG) emissions (Assembly Bill 32) through Green education/adoption of conservation measures
LADWP addressed these by Obtaining new high speed colorinkjet printers New software to reformat customer communications Design consulting starting with key stakeholder groups from within LADWP and the payer community Workflow management tools to support adaptive custom communications with the highest quality from raw data to USPS
After: Reduced the Six to Four Pages, added service category icons and attention grabbing color highlights Helpful Numbers Clear Highlights Personalized Summary Program
SZ Plus: Two Pages of Relevant Marketing To Grow Program Awareness & Value and future personalized communications
SZ Summary of New Statement Design Features • Goal = Reduce Customer Call Center volume by 20% • Improved Bill Remittance: Customer total due presented clearly on page 1 • Color: Color used to draw attention to key sections of bill as well as payment. • Graphical Diagrams: Graphs to show history patterns and peak usage. Visually show when product is used at what times it is optimal • Improved Clarity: Clear, crisp font makes reading easier on the eye. Swiss font allows for more content to fit in less space, thus saving paper • Sustainability: Eliminate inserts by using onserts. Messaging nearly guaranteed to be read (as opposed to throwing away a piece of paper) and reduces paper (supporting green practices)
Recap Customer communications are becoming more important than ever There are many benefits to addressing customer communications There are many technological and marketing tools available to create an integrated adaptive, personalized and relevant communications Leveraging modern customer analytics tools and redesigning your customer statements are two strategies which can increase return and decrease costs