Download
1 / 39
420 likes | 587 Vues
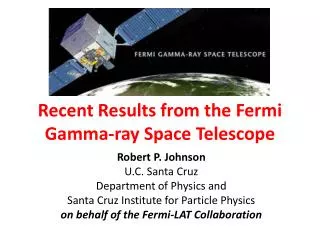
Gamma-Ray Results from Fermi Indirect Detection of Dark Matter. Robert P. Johnson U.C. Santa Cruz Department of Physics and Santa Cruz Institute for Particle Physics Representing the Fermi-LAT Collaboration. Fermi Observatory.

E N D
Gamma-Ray Results from FermiIndirect Detection of Dark Matter Robert P. Johnson U.C. Santa Cruz Department of Physics and Santa Cruz Institute for Particle Physics Representing the Fermi-LAT Collaboration
Fermi Observatory • Successful collaboration of particle physicists and astrophysicists. • 3 ton particle detector “telescope”. • million amplifiers; 5 computers. ApJ697, 1071, 2009 Large Area Telescope (LAT) D.o.E. GBM -ray Burst Monitor R.P. Johnson
2-Year All-Sky Map, E>1 GeV Counts Map The full Fermi-LAT photon data set is public, so contributions to DM searches have come from both within and outside the LAT collaboration. The entire sky is viewed by the LAT every three hours. R.P. Johnson
1451 Sources (>4 significance) First 11 months of data Ap.J. Supp. 188 (2010) 405 2FGL is coming soon: >1800 sources 630 R.P. Johnson New classes not associated (confidently) with -ray sources in 3rd EGRET catalog.
Searches for Dark Matter Annihilation (or Decay) • Exclusive final states: or Z • Unambiguous line signature. • But very low expected rates. • Inclusive production (primarily 0 decays and inverse Compton scattering). • Much higher rates, but the signal spectrum is not so easy to differentiate from diffuse and point-source backgrounds. • Localized sources: • Galactic center. • Dwarf spheroidal galaxies. • Dark satellites. • Galaxy clusters. • Diffuse sources: • Galactic halo. • Isotropic extragalactic diffuse emission. ? R.P. Johnson
Gamma-Ray Line Search, Year 1 Example fit, at 40 GeV (the fit with the largest line “signal”) 11 Months of data Almost all sky: Galactic plane removed, except for Galactic center. Sources removed by 0.2 cut. Fit to a power-law background plus a line at 40 GeV. The signal fraction and the power-law index float freely in the fit. PRL 104, 091302 (2010) R.P. Johnson
Gamma-Ray Line Search DM Limits Cross Section Upper Limits, for annihilation to (i.e. annihilation cross section times B.R. to ) Can rule out some esoteric models such as G. Kane et al., PAMELA Satellite Data as a Signal of Non-Thermal Wino LSP Dark Matter, Phys. Lett. B681:151, 2009. PRL 104, 091302 (2010) R.P. Johnson
Line Analysis of 2 Years of Data • Work extending the Fermi-LAT line analysis to 2 years of data will be presented next week at the Fermi Symposium. • Improved (not yet public) energy estimator based on shower profiles. • Studies of systematic effects in the energy using control samples (e.g. limb photons). Energy (GeV) R.P. Johnson
Line Analysis of 2 Years of Data • Work extending the Fermi-LAT line analysis to 2 years of data will be presented next week at the Fermi Symposium. • Improved (not yet published) energy estimator based on shower profiles. • Studies of systematic effects in the energy using control samples (e.g. limb photons). Non-LAT-collaboration analysis, Gilles Vertongen, ChristophWeniger, arXiv:1101.2610v1. This extends to much lower energy than the LAT results. The LAT team has been investigating systematic effects there, including a 4 significance “signal” at 6.5 GeV caused by systematic errors in the energy estimator. Preliminary WIMP Mass (GeV) R.P. Johnson
Galactic Center >32 months counts map with 1FGL sources plotted, LAT front section only for E>1 GeV 10 square HESS? PWN? PWN • + Pulsars • o Other Sources • Two LAT sources closest to the GC: • 1FGL J1745.6-2900c, 0.08 (HESS J1745-290?) • 1FGL J1746.4-2849c, 0.2 (PWN) R.P. Johnson 10
Galactic Center Chandra X-ray image >32 months counts map with 1FGL sources plotted, LAT front section only for E>1 GeV 10 square LAT front PSF at 1 GeV is about 0.5. A 0.5 cone at the GC covers 150 parsec diameter! HESS? PWN? PWN 40 pc • + Pulsars • o Other Sources • Two LAT sources closest to the GC: • 1FGL J1745.6-2900c, 0.08 (HESS J1745-290?) • 1FGL J1746.4-2849c, 0.2 (PWN) 52 pc R.P. Johnson
DM Detection in the GC? Excess point-like contribution • Thin converters (front section) only, so the 68% containment angle at 1 GeV is 0.5. • The disk model is fit to data along the Galactic ridge near the GC. • The bulge model is spherically symmetric and fits the data well outside of 2 degrees. Dashed: disk model Dotted: bulge model Hooper, Goodenough, Phys. Lett. B697, 412-428, 2011 R.P. Johnson
DM Detection in the GC? • Thin converters (front section) only, so the 68% containment angle at 1 GeV is 0.5. • The disk model is fit to data along the Galactic ridge near the GC. • The bulge model is spherically symmetric and fits the data well outside of 2 degrees. • The point-like excess cuts off above about 8 GeV and is not consistent with extrapolation from the HESS TeV source HESS J1745-290. • Inclusion of a cusped DM profile improves the fit, and the data are consistent with annihilation of a 7 to 10 GeV WIMP of <v>31026 cm3/s. • Other analyses, e.g. Boyarski et al., ArXiV:1012.5839v1, show consistency with diffuse emission and a GC point source. Dashed: disk model Dotted: bulge model Spherical point-like excess Extrapolation from TeV HESS source Hooper, Goodenough, Phys. Lett. B697, 412-428, 2011 MSP explanation: Kevork N. Abazajian, arXiv:1011.4275v3 R.P. Johnson
LAT Galactic Center Region Spectrum The Fermi-LAT collaboration has yet to publish on the GC region, other than the published catalog sources. This plot is for next week’s Fermi Symposium, showing an example spectral fit in a 5 square region about the GC, including numerous sources plus a particular GALROP model for the diffuse. Some residuals are apparent around a few GeV but are at no more than the 5% level. • Dashed Lines: • Galactic Diffuse Model • Isotropic Diffuse • Solid Lines: Sources Sources (solid) Preliminary Fractional Residuals Preliminary R.P. Johnson
LAT Galactic Center Spatial Residuals Preliminary Preliminary Preliminary 10<E<30 GeV 60% +250% 1<E<3 GeV 35% +35% 3<E<10 GeV 55% +90% 5 degree square region about the GC 0.1 degree square pixels (counts model)/model R.P. Johnson
Galactic Halo • The DM signal is a small bump on a very large diffuse background. • Fermi will have the statistical power to see it, but • Systematic uncertainties in the background models! • Systematic uncertainties in the instrumental effective area! |b|>10 GALPROP • 100 GeV WIMP annihilating to b quarks with v=31026 cm3/s. • Via-Lactea II Galaxy model, including boost for unresolved substructure. GALPROP: Strong, Moskalenko, Reimer 2000, ApJ. 437, 763. Via Lactea II: Diemand et al 2008, Nature 454, 735. R.P. Johnson
High Latitude Diffuse Emission • The first Fermi-LAT publication on the galactic diffuse spectrum strongly disagreed with the EGRET spectrum. • In particular, there is no huge “GeV excess” with respect to standard models of the diffuse production from cosmic rays. |b|>10, so most of the diffuse emission is local (especially for 0) PRL 103, 251101, 2009 R.P. Johnson
Local Diffuse Emission • View toward the 2nd Galactic quadrant, including the Galactic plane. • Dominated by the Gould belt and local arm. • Good kinematic separation of radio signatures • View toward the 3rd Galactic quadrant, but large Galactic latitude. Region with no large molecular clouds and with most of the atomic hydrogen within 1 kpc. 15<b<30 |b|>22 Abdo et al. 2009, ApJ 703, 1249 Abdo et al. 2009, ApJ 710, 133 The gamma-ray data are well modeled by the local cosmic-ray spectra, but the HI emissivity in the 2nd quadrant must be increased relative to prior estimates. R.P. Johnson
High Latitude Diffuse Emission Source Dist., Halo h, Halo R, Spin Temp, Dust • Extensive work under way to model the diffuse emission. • Right: one of a grid of 128 GALPROP models. • All models respect constraints from local cosmic ray measurements (e.g. B/C ratio). • No obvious “best model”, and small but significant residuals persist. • This high latitude excess is similar to what some analyses see in the GC region. • Spatial residuals are under 10% except in lobes, Loop-1, and outer galaxy. XCO is fit to gamma rays From Dec. 2010 talk by GudlaugurJohannesson in Paris (“Dark Matter All Around”) R.P. Johnson
Halo Dark Matter Limits Two groups within the LAT collaboration have been working for some time on deriving DM limits from the diffuse analysis. • No models give high quality fits over the full sky (|b|>10). • Large spatial and spectral residuals, compared with the small LAT statistical errors! • (The official LAT diffuse model (ring model) has far too many ad-hoc parameters to be used in searches for new physics.) • Not surprising, given the residuals that we have seen above, the fits often give a positive value for the DM abundance, but • No confidence in ruling out systematic errors in the diffuse background model and in the LAT effective area as the source of the residuals! • Very difficult to quantify with any rigor the effects of uncertainty in the diffuse background model and the effective area. • Nevertheless, we expect these analyses to converge on publishable limits this year R.P. Johnson
DM Limits from High Latitude Diffuse • 21 months of data from 800 MeV to 100 GeV • ROI: 5|b|15; 75 75 • Blue curves are very conservative upper limits derived assuming that all diffuse photons are from dark matter. • The shaded region is excluded by a fit that includes a Galactic diffuse model as well as dark matter and the isotropic diffuse. • Normalizations, in several Galactocentric rings, of GALPROP cosmic-ray interactions with gas maps (HI and H2) and ISRF, are allowed to vary freely in the fit, as is the isotropic diffuse. R.P. Johnson
Dwarf Spheroidal Galaxies Large satellite galaxies Well-known dSphs dSphs discovered by SDSS Belokurov, V., et al. 2007, ApJ, 654, 897 R.P. Johnson
Dwarf Spheroidal Galaxies, DM Search Select 10 dSphs away from the galactic plane and not too distant. Require good stellar kinematic data and high mass/light of 10 to over 1000. No gamma ray signal is seen yet from any of these sources. Belokurov, V., et al. 2007, ApJ, 654, 897 R.P. Johnson
Dwarf Spheroidal Galaxies DM Limits • Stellar data from Keck (Bullock, Kaplinghat, Martinez) were used to evaluate the DM content of each of 8 dwarfs, to translate the flux limits into annihilation cross section limits. No substructure boost assumed. • Red points are MSSM models with a cosmological WIMP thermal relic density compatible with WMAP data. Published results based on the first 11 months of data. v(1026 cm3/s) 31026 cm3/s ApJ 712 (2010) 147. WIMP Mass (GeV) R.P. Johnson
Dwarf “Stacking” Analysis • 24 months of data • Combined fit to 10 dwarfs, with common DM v free parameter • Carina and Segue-1 added to the analysis • Analysis takes into account uncertainties of the astrophysics “J factors”: The J factors are the integral of the following function over a 0.5 radius cone about the dwarf location, assuming an NFW profile: v No substructure boost assumed. R.P. Johnson
Dwarf “Stacking” Analysis Upper Limits • 24 months of data • Combined fit to 10 dwarfs, with common DM v free parameter • Carina and Segue-1 added to the analysis • Analysis takes into account uncertainties of the astrophysics “J factors”: Limits for other DM channels will be shown at the Fermi Symposium in Rome next week. Thermal WIMP 10 GeV WIMP apparently ruled out 33 GeV R.P. Johnson
Dark Satellites; Expectations • Via Lactea-2 simulation of the DM galaxy (Nature 454, 735) • Including a boost for unresolved substructure • Sample 10 viewing points 8 kpc from the Galactic center • WIMP annihilation to b,b-bar using Dark-SUSY (JCAP 0407, 008) • Nominal expected thermal WIMP cross section: 3×1026 cm3/s • MC simulation of the Fermi-LAT instrument response • 10 year observation time Simulation only—no data Expected number of DM halo objects visible at 3 std. dev. significance. Expected number of DM halo objects visible at 5 std. dev. significance. B. Anderson et al., Ap. J. 718 (2010) 899. R.P. Johnson
Dark Satellites; Searches • One year of data. • Test unidentified sources (|b|>20) for • Non-power-law spectrum, • Detectable source extension (non point-like). This test is essential to remove contamination from high latitude gamma-ray pulsars. • No unidentified sources satisfy both selection criteria. • One source passed both tests but appeared to be a conjunction of two sources, one of which was subsequently discovered to be a millisecond pulsar. • A paper is in preparation to interpret this null result in terms of DM limits, based on the Via Lactea II and Aquarius galaxy simulations. Aquarius: V. Springel et al., ArXiv:0809.0898 R.P. Johnson
Galaxy Clusters • No observation thus far of gamma rays from galaxy clusters (whether originating from DM or CR), besides clusters hosting AGN. • Fermi-LAT publication based on 11 months of data: JCAP, doi:10.1088/1475-7516/2010/05/025 Limits for just 2 of the clusters Effect of substructure MSSM R.P. Johnson
Galaxy Cluster “Stacking” Analysis • 24 months of data • 200 MeV to 100 GeV • 5 “nearby” clusters: • AWM7 • Fornax • Centaurus • Coma • M49 R.P. Johnson
Galaxy Cluster “Stacking” Analysis • 24 months of data • 200 MeV to 100 GeV • 5 “nearby” clusters: • AWM7 • Fornax • Centaurus • Coma • M49 • DM limits from combined likelihood fit. • Smooth NFW profile assumed (no substructure) • Up to a factor of 2 improvement by use of the combined fit Preliminary (J-Factor uncertainties not considered) R.P. Johnson
Isotropic (Extragalactic) Diffuse Emission A published Fermi-LAT analysis has extracted the isotropic flux of gamma rays (believed to be primarily extragalactic) by reducing and understanding the residual CR background. • Based on Fermi measurements of the blazar luminosity function (Ap.J. 720, 435, 2010), unresolved AGN can account for up to 30% of this diffuse (blue shaded). • Star forming galaxies account for much of the rest. See the estimates above for two different assumptions on the spectrum (red and green shaded) Preliminary |b|>10 =2.41 0.05 Star forming galaxies Models: PRL 104, 101101, 2010 R.P. Johnson
Cosmological Dark Matter The isotropic extragalactic contribution have been interpreted in terms of limits on cosmological dark matter annihilation: JCAP04 (2010) 014 Models of absorption by EBL DM structure evolution scenarios DM could supply all the photons in a given bin Assuming a power-law model for astrophysical background Large dependence on model of DM structure R.P. Johnson
Conclusions • No unambiguous signature of dark matter annihilation in the gamma-ray sky, despite some intriguing residuals. • Some of the most interesting limits are from the dwarf satellites • Low background • Solid interpretation, based on DM content derived from stellar velocity measurements • Besides expected statistical improvements by up to a factor of 2, the DM sensitivity from dwarfs may improve to 100 GeV or more due to • More and better stellar velocity measurements • Discovery of more dwarfs, especially in the southern hemisphere using new survey telescopes. • Better sensitivity to DM annihilation in the diffuse Galactic halo or the Galactic center requires improved understanding of the diffuse background caused by cosmic-ray propagation and interaction. • In general this exercise would be tremendously invigorated and aided by the discovery of WIMP candidates at the LHC! R.P. Johnson
Extra Slides R.P. Johnson
High Latitude Diffuse Emission • Extensive work under way to model the diffuse emission. • Right: one of a grid of 128 GALPROP models. • All models respect constraints from local cosmic ray measurements (e.g. B/C ratio). • No obvious “best model”, and small but significant residuals persist. • High latitude excess is very similar to what we saw in the GC region. • Spatial residuals are under 10% except in lobes, Loop-1, and outer galaxy. • Still, many models explain the data reasonably well. From Dec. 2010 talk by GudlaugurJohannesson in Paris (“Dark Matter All Around”) R.P. Johnson
GC MSP Interpretation • Hooper & Goodenough discredit an MSP explanation: • Spectrum is different from the average of known gamma-ray MSPs. • Would require a dense population of MSPs near the GC. In any case, mundane astrophysics explanations of the GC source cannot be ruled out! Kevork N. Abazajian, arXiv:1011.4275v3 • Others disagree. For example, Abazajian argues that • The H&G extracted GC spectrum is consistent with gamma-ray spectra from four globular clusters. • Although as noted by H&G, the fitted spectral indices do have large statistical errors. • The central star cluster of the GC fits within the LAT PSF and is 1000 times more massive than the largest globular cluster (Omega Cen.). • The analysis has not fully considered the systematic effects of the subtracted background model on the spectrum. R.P. Johnson
DM Upper Limits from the Full |b|>10 Sky A profile likelihood fit to the DM content (for a given DM model and WIMP mass) encompasses variations over many systematic parameters: • GALPROP CR propagation parameters (constrained by a 2 fit to local CR spectra and isotope ratios): • CR source distribution • Halo height , diffusion constant, and Alfven velocity • Electron and hadron injection indices • Electron normalization (allowed to vary well outside of the local measurement) • Normalization of maps of CR targets, in several Galactic rings: • 0 production of gammas: • Atomic hydrogen (large uncertainties in spin temperature) • Ionized hydrogen (minor contribution) • Molecular hydrogen (uncertainties and variations in XCO) • Inter-Stellar Radiation Field (inverse-Compton production of gamma rays) • Energy-dependent uncertainties in the LAT effective area • Normalization of the isotropic diffuse, including instrumental backgrounds R.P. Johnson
Methodology to Account for Diffuse Background For practical reasons, GALPROP parameters cannot be varied continuously in a fit. We must make a discrete sampling of the likelihood space. Each point represents the best DM fit when using a single GALPROP model to describe the diffuse background. Course sampling of GALPROP parameters ½ 2 of fit to local CR data Finer sampling near the minimum contours of constant global log of fit to the -ray data • Work in progress: dark matter upper limits will be derived from the ensemble of likelihood profiles after • finalizing the ranges of variations of parameters and • filling in a denser sampling near the minimum. log Likelihood profile for each GALPROP model Amount of Dark Matter R.P. Johnson