Download
1 / 31
390 likes | 559 Vues
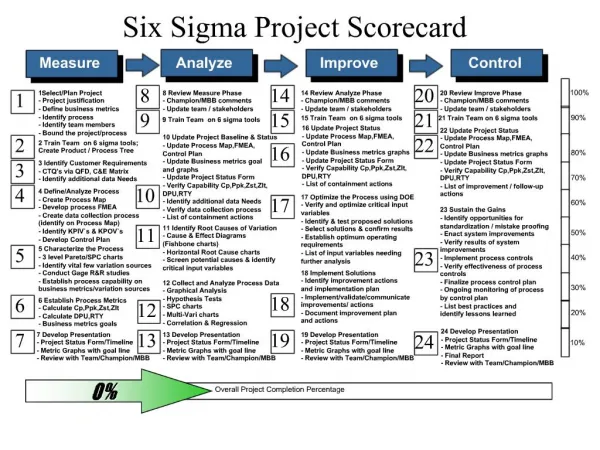
The UW Colleges’ Equity Scorecard Project. UW-Fond du Lac January 29, 2008 Greg Lampe – Interim Provost and Vice Chancellor Gregg Nettesheim – Institutional Researcher. Equity Scorecard: Why is this so important?. Fall term new freshman Part-time (< 12 credits)

E N D
The UW Colleges’ Equity Scorecard Project UW-Fond du Lac January 29, 2008 Greg Lampe – Interim Provost and Vice Chancellor Gregg Nettesheim – Institutional Researcher
Equity Scorecard: Why is this so important? • Fall term new freshman • Part-time (< 12 credits) • Under prepared (graduated from high school in bottom half of class) • Traditional Age (< 22) • Non-white She has a 1 in 10 chance of returning next fall
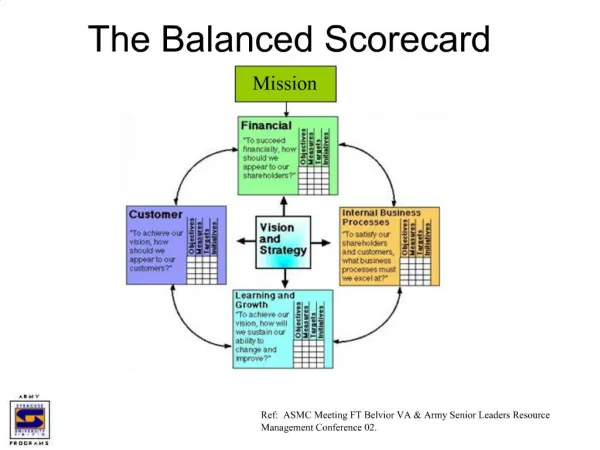
What is the Equity Scorecard? A toolused to organize institutional data into indicators of performance that facilitate meaningful discussion and institutional self-assessment
What is the Equity Scorecard? • An institutional process of becoming aware of racial inequities, interpreting the meaning of these inequities, and acting to address those inequities. • Regards inequities in educational outcomes as a problem of institutional performance, rather than of student deficiencies • The Benchmark for Equity is White Students
UWC Equity Scorecard Evidence Team Members • Brett Barker, Assistant Professor, History, UW-Marathon County • Salah Bassiouni, Associate Professor, Anthropology/Sociology, UW-Waukesha • Salvador Carranza, Institutional Planner, UW System Administration • Deborah Cureton, Campus Dean, UW-Richland • Greg Lampe, Interim Vice Chancellor, UW Colleges (Team Leader) • Pa Lee Moua, Multicultural Advisor, UW-Fox Valley • Martha Nelson, Assistant Campus Dean for Student Services, UW-Washington County • Gregg Nettesheim, Institutional Researcher, UW Colleges
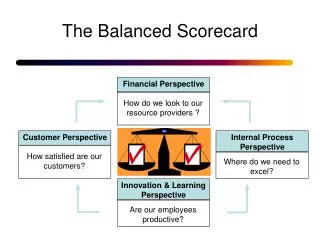
ACCESS Objective Baseline Improvement Equity Target RETENTION EXCELLENCE Equity in Educational Outcomes Objective Objective BaselineImprovement Equity Target BaselineImprovement Equity Target INSTITUTIONAL RECEPTIVITY Objective BaselineImprovement Equity Target What is the Equity Scorecard? A framework of perspectives on equity
Equity Scorecard: Access Perspective • This perspective refers to access to the institution as well as campus-based programs and resources that can significantly improve life opportunities for historically underrepresented students • Align this perspective to our mission of access and to our identity as regional two-year transfer institutions • Focus on enrollment of potential student populations
Equity Scorecard: Access Perspective • Potential Student Populations – the Campus High School Enrollment Equity Model: • Campuses recruit most new 1st year students from a limited number of high schools – the “high school market” • Determine by high school if we are enrolling proportionally by race. • Equity is a rate of enrollment equal to that for white students at a given high school
Equity Scorecard: Access Perspective • The High School Enrollment Equity Model Example – 5 Year Aggregate *The sum of 12th graders enrolled in the 5 years 2000-01 through 2004-05 (DPI census data) **The sum of fall term new freshmen from this school enrolled 2001-02 through 2005-06
Equity Scorecard: Access Perspective • The Campus High School Enrollment Equity Model Example – 5 Year Aggregate *The sum of 12th graders enrolled in the 5 years 2000-01 through 2004-05 (DPI census data) **The sum of fall term new freshmen from this school enrolled 2001-02 through 2005-06
Equity Scorecard: Access Perspective • High School Enrollments by Race – Fall 2006 Based on fall 2006 Wi Department of Public Instruction School Census
Equity Scorecard: Retention Perspective • This perspective refers to continued attendance from one year to the next and/or completion of degrees • Focus: • 1. Retention in Colleges, and • 2. classroom success
Equity Scorecard: Retention Perspective • Regarding Course Load and Retention: • Historically, most studies of retention have focused exclusively on full-time students • At the UWC ⅓ of students attend part-time • Include part-time students, but exclude new freshmen enrolled for 1-5 credits
Equity Scorecard: Retention Perspective • Regarding High School Rank, Age and Retention: • High school rank is a good measure of readiness for college and is routinely used for making admission decisions and for predicting retention • For many non-traditional age students high school rank data is not available • High school rank is less effective for predicting retention of non-traditional age students
Equity Scorecard: Retention Perspective The Retention Equity Model • Combine Course Load, Age, High School Rank and Race: • Step 1 - Group students by course load • Step 2 – Create 3 three sub-groups • Traditional age students from top half of high school class • Traditional age students from bottom half of class • Non-traditional age students • Step 3 – Summarize by race
Equity Scorecard: Retention Perspective • The Student Retention Equity Model - Example: UWC full-time new freshmen fall 2001 – fall 2005 With the % retained to a 2nd year (fall to fall) Equity in retention is a rate equal to that for white students
Equity Scorecard: Excellence Perspective • This perspective refers to indicators which reflect excellent performance among students from low income and traditionally underserved racial/ethnic groups • Focus: Academic performance of admissible and non-admissible students
Equity Scorecard: Excellence Perspective • The Evidence Team agreed upon the six following factors as indicators of excellence in the UW Colleges: • Associate of Arts and Science degree attainment • Performance in the top 25 enrolling courses at UWC • Dean’s List achievement • GPA at UWC and after transfer • Transfer rates to 4-year UW institutions
Equity Scorecard: Excellence Perspective Linking Excellence to Access • Identify students not admissible at any other UW institution • Measure the performance of these students separately • This becomes an assessment of the fulfillment of the UW Colleges’ mission of access as well as a measurement of excellence
Equity Scorecard: Excellence Perspective Average Cumulative GPA for Students Fall 2000 – Spring 2006 – enrolled 2 or more terms
Equity Scorecard: Excellence Perspective Dean’s List Attainment by Race - 2003-04 through 2005-06
Equity Scorecard: Institutional Receptivity Perspective • This perspective refers to goals and measures of institutional support that have been found to be influential in the creation of affirming campus environments for underserved students • Focus: Campus and classroom climates
Equity Scorecard: Institutional Receptivity Perspective • Agreed Upon Measures: • Community College Survey of Student Engagement – spring 2005; • Foundations of Excellence Student Survey – fall 2006; • Educational Benchmarking Inc. Campus Climate Survey – spring 2006. • All data is Colleges-wide
Equity Scorecard: Institutional Receptivity Perspective Where Institutional Receptivity is experienced: • On the campus • In the classroom
Equity Scorecard: Institutional Receptivity Perspective - Campus Characterize Equal Treatment on Your Campus Source: EBI Climate Survey – spring 2006
Equity Scorecard: Institutional Receptivity Perspective - Campus Frequency of Expressions of Insensitivity – from faculty/staff and from students Source: EBI Climate Survey – spring 2006
Equity Scorecard: Institutional Receptivity Perspective - Classroom Classroom Environment - Inclusivity Source: EBI Climate Survey – spring 2006
Equity Scorecard: Institutional Receptivity Perspective - Classroom Tensions – To what degree is this present at this college/university: Interracial tensions in the classroom (Note: question responses have been reversed) Scale(1) Extremely, (2),(3),(4) Moderately,(5),(6),(7) Not at all, NA Source: EBI Climate Survey – spring 2006
Equity Scorecard: Institutional Receptivity Perspective Key findings: • On campus Native American students are the most isolated of all racial groups. For these students the classroom is more receptive than the campus as a whole. • For Black students, the campus environment is more receptive than the classroom environment (though they are keenly aware of racial separation on campus).
Equity Scorecard: Institutional Receptivity Perspective Key Findings: • Students of color are much more conscious of unequal treatment of others than are white students, regardless of the perceived reason for the unequal treatment. • Students of all races (including white students) are two to three times as likely to hear insensitive or disparaging remarks from other students than from faculty or staff.
Equity Scorecard Project • Questions, comments, and/or suggestions • For more information visit Public Folders>All Public Folders>Initiatives (Colleges-wide)>Equity Scorecard • Thank you!