Download
1 / 30
300 likes | 416 Vues
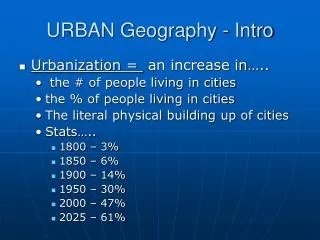
Ten Years of Urban Air Quality Management in India: Findings of a Recent Study Across Five Cities. Presented at National Workshop on Urban Air Quality and Integrated Traffic Management Karachi, 13 th – 14 th September 2006. 400. 350. 300. 250. 200. concentration in µ g/m. 150. 100.

E N D
Ten Years of Urban Air Quality Management in India: Findings of a Recent Study Across Five Cities Presented at National Workshop on Urban Air Quality and Integrated Traffic Management Karachi, 13th– 14th September 2006 Sameer Akbar, The World Bank
400 350 300 250 200 concentration in µg/m 150 100 50 0 Pune Seoul Tokyo Manila Osaka Busan Jakarta Kolkata Bangkok Mumbai Colombo Shanghai New Delhi Singapore Hong Kong Chongqing Air Quality Levels 2000-2001 SO2 Limit = 50 µg/m3 (WHO, 1999) SPM Limit = 90 µg/m3 (WHO, 1979) Source: Information collected from national and local government agencies through CAI-Asia network, 2003, detailed sources available from CAI-Asia Secretariat SPM SO2 NO2 Limit = 40 µg/m3 (WHO, 1999) PM10 Limit = 50 µg/m3 (USEPA, 1997) Sameer Akbar, The World Bank PM10 NO2
Background • Very high levels of urban air pollution, especially particulate pollution, in Indian cities in the 1990’s. • Independent analyses estimated that it could be responsible for significant health damage. • A series of policy interventions followed, in which civil society and judiciary have played a major role (Delhi has set an example) • A number of other highly polluted cities to prepare “action plans” for addressing urban air pollution. Sameer Akbar, The World Bank
Context • On-going debate among air quality experts about the exact impacts of specific measures that have already been taken, and by how much the urban air quality has improved as a result. Sameer Akbar, The World Bank
Objectives • To strengthen, within the limits of the available data and analytical methods, the understanding of factors influencing ambient air quality in different cities so as to assist in the process of formulating future city-level strategies and action plans for addressing urban air pollution. Sameer Akbar, The World Bank
City Selection • Five major cities—Delhi, Mumbai, Kolkata, Chennai, and Hyderabadall with a population of more than 5 million inhabitants in the metropolitan area. These cities, • cover a wide range in the levels of PM pollution; • cover different geographical locations (north, south, east, and west), diverse climatic conditions, and both coastal and inland cities; • have relatively more extensive data available; • represent a sample that has had policy interventions; and • are also on the list of the cities that have been asked to develop “action plans” to address PM pollution. Sameer Akbar, The World Bank
PM Averages (2002) NEERI Data Sameer Akbar, The World Bank
What efforts have been made to address urban air pollution ? Sameer Akbar, The World Bank
Delhi: Chronology of Key Actions • 1994-95: Transport • Introduction of Catalytic Converters and Unleaded petrol • 1996: Transport & Industry • Fuel Quality: 0.5% S diesel introduced • CNG vehicles and catalytic converters for government petrol vehicles, excluding public transport introduced (but unsuccessful) • Closure of 168 hazardous industries, including stone crushers completed • Lower Sulphur content in coal (0.4% S) and oil for industrial use (1.8%) introduced • 1997: Industry • Relocation of 513 industries • 337 hazardous category industries shifted (total of 1160 industries closed or relocated including hot mix plants, arc induction furnaces, brick kilns) Sameer Akbar, The World Bank
1998: Transport • Supply of only premix petrol in all petrol filling stations to two stroke engine vehicles; ban on supply of loose 2T oils • Phasing out/ban on old commercial/transport vehicles (>15 yrs) • Start of major construction program: flyovers plus the Delhi metro • 1999: Transport • Registration of only EURO II 3-wheelers and diesel taxis • Restricting the plying of goods vehicles during the day • Diesel sulphur reduced to 0.25% • 2000: Transport, Industry & Urban • Diesel and gasoline sulphur reduced to 0.05% in selected outlets • Replacement of all pre-1990 3-wheelers and taxis with new vehicles on clean fuels • All private 4-wheeled vehicles to conform to Euro II • Buses more than 8 Yrs phased out or to ply on CNG • The three coal based power plants to switch over to beneficiated coal • Piped NG by March 2000 to 1311 domestic, 9 small, and 3 large commercial establishments Sameer Akbar, The World Bank
2001: Transport, Industry & Urban • Replacement of all post-1990 3-wheelers and taxis with new vehicles on clean fuels • Sulphur content in diesel further reduced to 0.05% in select outlets • Number of CNG vehicles as follows: 14000 3-w; 2200 taxis; 400 buses; 250 RTVs; 9500 private (26350 total) • Piped NG by March to 2821 domestic, 15 small , and 5 large commercial establishments • Hazardous Industry closure continues: total of 3538 closed • 2002: Transport & Urban • 94 CNG stations setup up to March • All diesel buses phased-out / converted to CNG. • Number of CNG vehicles as follows: 35678 3-w; 4816 taxis; 4231 buses; 2165 RTVs; 10350 private (57240 total) • Piped NG by March to 4111 domestic, 37 small , and 5 large commercial establishments • 16340 non-destined good vehicles turned away from entering Delhi between July and November Sameer Akbar, The World Bank
Kolkata: Chronology of Key Actions • 1995: Industry • Air polluting industries directed to install air pollution control devices • 1996: Transport • Fuel Quality: 0.5% S diesel mandated • 1997: Industry • Siting policy for red category (hazardous) industry was implemented • 1998: Transport • Low smoke 2T oil for two-stroke engine vehicles mandated • 0.25% S diesel mandated in Kolkata Metropolitan Area • 1999: Transport • Pre-mixed 2T oil for two-wheelers mandated • 2000: Transport • Diesel sulphur reduced to 0.25% for all of Kolkata • 2001: Transport & Industry • Low sulphur petrol and diesel (0.05%) mandated • The use of cleaner fuels made mandatory in industrial boilers Sameer Akbar, The World Bank
Mumbai: Chronology of Key Actions • 1996: Transport & Industry • Fuel Quality: 0.5% S diesel mandated • Textile industries decline started after the strikes of textile workers • 1997: Transport & Urban • CNG conversion of taxis started • Construction of large number of flyovers started • 1998: Transport • Low smoke 2T oil for two-stroke engine vehicles mandated • CNG conversion of taxis on a large scale • 1999: Transport • Pre-mixed 2T oil for two-wheelers mandated • 2000: Transport & Industry • Diesel sulphur reduced to 0.25% • Conversion of a number of industries to natural gas • 2001: Transport & Industry • Low sulphur petrol and diesel (0.05%) mandated • 2002: Transport • Age-based phase out of taxis and 3-wheelers unless converted to LPG/CNG Sameer Akbar, The World Bank
Hyderabad: Chronology of Key Actions • 1996: Transport • Fuel Quality: 0.5% S diesel mandated • 1998: Transport • Low smoke 2T oil for two-stroke engine vehicles mandated • 1999: Transport • Pre-mixed 2T oil for two-wheelers mandated • 2000: Transport & Urban • Diesel sulphur reduced to 0.25% • Construction of flyovers started • 2001: Transport & Urban • Construction of by-pass roads for heavy vehicles started • Widening of roads undertaken • 2002: Transport • Stopping of permit to new autorickshaws Sameer Akbar, The World Bank
Chennai: Chronology of Key Actions • 1996: Transport • Fuel Quality: 0.5% S diesel mandated • 1998: Transport • Low smoke 2T oil for two-stroke engine vehicles mandated • 1999: Transport • Pre-mixed 2T oil for two-wheelers mandated • 2000: Transport • Diesel sulphur reduced to 0.25% • 2001: Transport • Low sulphur diesel & petrol (0.05%) mandated • 2002: Transport & Urban • Entry of old buses into the center of the city prohibited, and old buses diverted to new bus terminal in the outskirts Sameer Akbar, The World Bank
What were the effects of those efforts on air quality ? Sameer Akbar, The World Bank
Annual Average RSPM Concentration Sameer Akbar, The World Bank
Delhi: RSPM by Area (Ann. Avgs.) Sameer Akbar, The World Bank
What are the health impacts of changes in air quality ? Sameer Akbar, The World Bank
Changes in RSPM levels Sameer Akbar, The World Bank
Health benefits of changes in RSPM Sameer Akbar, The World Bank
What are the key factors that affect air quality and need to be considered in strategies and action plans ? Sameer Akbar, The World Bank
Relative Contribution of Sources to PM2.5 in 2001 Source: ESMAP 2004 Sameer Akbar, The World Bank
Relative Contribution of Sources The results indicated that there was no single dominant source in Delhi, Kolkata, and Mumbai, but rather three principal sources of particulate air pollution: vehicle exhaust, re-suspended road dust, and solid fuels. The use of solid fuels in more pronounced in cities with colder winters. Sameer Akbar, The World Bank
Delhi: Role of Meteorological Parameters Sameer Akbar, The World Bank
Chennai: Role of Meteorological Parameters Sameer Akbar, The World Bank
6. What do the findings of this study tell ? Sameer Akbar, The World Bank
Concluding Remarks • RSPM, the main pollutant of public health concern, fell between 1993 and 2002. Clearly, the interventions undertaken had some effect ! • This decline in RSPM levels might have led to nearly 13,000 fewer cases of premature deaths and much greater reductions in the number of cases of respiratory illness annually in the five cities by 2002, than in the early 1990s. • Despite substantial past progress the levels of RSPM are the highest and dangerously above the national standards in the northern cities of Delhi and Kolkata, especially in winter. • Given that there is no established threshold for health impacts from exposure to RSPM, all cities will gain substantial health benefits from further reductions. • Reductions in RSPM concentrations have been achieved through a combination of measures targeting industry, transport, and better urban planning / development. This is an important lesson for developing “action plans”. Sameer Akbar, The World Bank
Sector-wise summary of key actions across the cities Sameer Akbar, The World Bank
Thank You All! The full report entitled For a Breath of Fresh Air: Ten Years of Progress and Challenges in Urban Air Quality Management in India 1993-2002 can be accessed at http://www.worldbank.org/sarurbanair Sameer Akbar, The World Bank