Download
1 / 1
10 likes | 22 Vues
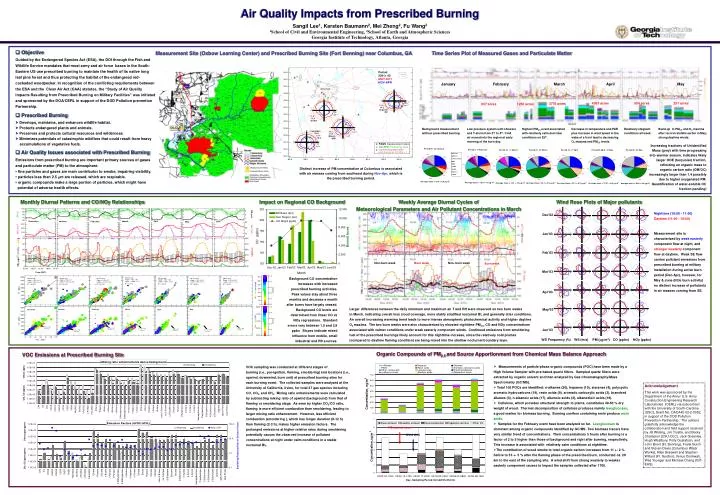
Air Quality Impacts from Prescribed Burning Sangil Lee 1 , Karsten Baumann 2 , Mei Zheng 2 , Fu Wang 2 1 School of Civil and Environmental Engineering, 2 School of Earth and Atmospheric Sciences Georgia Institute of Technology, Atlanta, Georgia.

E N D
Air Quality Impacts from Prescribed BurningSangil Lee1, Karsten Baumann2, Mei Zheng2, Fu Wang21School of Civil and Environmental Engineering, 2School of Earth and Atmospheric SciencesGeorgia Institute of Technology,Atlanta, Georgia Measurement Site (Oxbow Learning Center) and Prescribed Burning Site (Fort Benning) near Columbus, GA Time Series Plot of Measured Gases and Particulate Matter January February March April May 4067 acres 504 acres 251 acres 3770 acres 937 acres 1256 acres Background measurement without prescribed burning. Low pressure system with showers and T-storm from 3rd to 4th. Cold air moved into the region at early morning of the burn day. Highest PM2.5 event associated with relatively calm and clear conditions on 25th. Decrease in temperature and PAR plus increase in wind speed in the wake of a front lead to decreasing O3 maxima and PM2.5 levels. Relatively stagnant conditions all week. Build-up in PM2.5 and O3 maxima after record rainfalls earlier in May; strong daytime winds. Objective Guided by the Endangered Species Act (ESA), the DOI through the Fish and Wildlife Service mandates that most army and air force bases in the South- Eastern US use prescribed burning to maintain the health of its native long leaf pine forest and thus protecting the habitat of the endangered red- cockaded woodpecker.In recognition of the conflicting requirements between the ESA and the Clean Air Act (CAA) statutes, the “Study of Air Quality Impacts Resulting from Prescribed Burning on Military Facilities” was initiated and sponsored by the DOA/CERL in support of the DOD Pollution prevention Partnership. Prescribed Burning Develops, maintains, and enhances wildlife habitat. Protects endangered plants and animals. Preserves and protects cultural resources and wilderness. Minimizes potentials of catastrophic wildfires that could result from heavy accumulations of vegetative fuels. Air Quality Issues associated with Prescribed Burning Emissions from prescribed burning are important primary sources of gases and particulate matter (PM) to the atmosphere. fine particles and gases are main contributor to smoke, impairing visibility. particles less than 2.5 mm are released, which are respirable. organic compounds make a large portion of particles, which might have potential of adverse health effects. Increasing fractions of Unidentified Mass (grey) with time progressing into warmer season, indicates likely larger OOE (turquoise) fraction, reflecting an organic mass to organic carbon ratio (OM/OC) increasingly larger than 1.4 possibly due to higher oxygenated PM. Quantification of water-soluble OC fraction pending! Distinct increase of PM concentration at Columbus is associated with air masses coming from southeast during Nov-Apr, which is the prescribed burning period. Monthly Diurnal Patterns and CO/NOy Relationships Impact on Regional CO Background Weekly Average Diurnal Cycles of Meteorological Parameters and Air Pollutant Concentrations in March Wind Rose Plots of Major pollutants Nighttime (18:00 - 11:00) Daytime (11:00 - 18:00) Dec’02 Measurement site is characterized by weak easterly component flow at night, and stronger westerly component flow at daytime. Weak SE flow carries pollutant emissions from prescribed burning at military installation during active burn period (Dec-Apr), however, for May & June (little burn activity) no distinct increase of pollutants in air masses coming from SE. Jan’03 Feb’03 Non-burn week Burn week Non- burn week Burn week Mar’03 Background CO concentration increases with increased prescribed burning activities. Peak values stay about three months and decrease a month after burns have largely ceased. Background CO levels are determined from linear CO vs NOy regressions. Standard errors vary between 1.5 and 2.8 ppbv. Slopes indicate mixed influence from mobile, small industrial and PB sources. Apr’03 Larger differences between the daily minimum and maximum air T and RH were observed on two burn weeks in March, indicating overall less cloud coverage, more stably stratified nocturnal BL and generally drier conditions. An overall increasing warming trend leads to more intense atmospheric photochemical activity and higher daytime O3 maxima. The two burn weeks were also characterized by elevated nighttime PM2.5, CO and NOy concentrations associated with calmer conditions under weak easterly component winds. Continued emissions from smoldering fuel of the prescribed burnings likely account for this nighttime increase, since the relatively cold plumes (compared to daytime flaming condition) are being mixed into the shallow nocturnal boundary layer. May’03 Jun’03 PM (mg/m3) WD Frequency (%) WS (m/s) CO (ppbv) NOy (ppbv) VOC Emissions at Prescribed Burning Site Organic Compounds of PM2.5 and Source Apportionment from Chemical Mass Balance Approach • Measurements of particle-phase organic compounds (POC) have been made by a High Volume Sampler with pre-baked quartz filters. Sampled quartz filters were extracted by organic solvent and then analyzed by Gas Chromatography/Mass Spectrometry (GC/MS). • Total 105 POCs are identified: n-alkanes (20), hopanes (10), steranes (4), polycyclic aromatic hydrocarbons (19), resin acids (9), aromatic carboxylic acids (3), branched alkanes (3), n-alkanoic acids (17), alkenoic acids (3), alkanedioic acids (19). • Cellulose, which provides structural strength to plants, constitutes 40-50 % dry weight of wood. Thermal decomposition of cellulose produces mainly levoglucosan, a good marker for biomass burning. Burning conifers containing resin produce resin acids. • Samples for the February event have been analyzed so far. Levoglucosan is dominant among organic compounds identified by GC/MS. Two biomass tracers have very similar trend of concentrations. Their concentrations 5 hours after burning is a factor of 2 to 5 higher than those of background and right after burning, respectively. This increase is associated with relatively calm conditions at nighttime. • The contribution of wood smoke to total organic carbon increases from 11 +- 2 % before to 53 +- 5 % after the flaming phase of the prescribed burn, conducted ca. 28 km to the east of the sampling site. A wind shift from strong westerly to weaker easterly component causes to impact the samples collected after 1700. VOC sampling was conducted at different stages of burning (i.e., pre-ignition, flaming, smoldering) and locations (i.e., upwind, downwind, burn unit) at prescribed burning sites for each burning event. The collected samples were analyzed at the University of California, Irvine, for total 47 gas species including CO, CO2, and CH4. Mixing ratio enhancements were calculated by subtracting mixing ratio of upwind (background) from that of flaming or smoldering stage. As seen by higher CO2/CO ratio, flaming is more efficient combustion than smoldering, leading to larger mixing ratio enhancement. However, less efficient combustion (smoldering ), which has longer duration (8-12 h) than flaming (2-3 h), makes higher emission factors. The prolonged emissions at higher relative rates during smoldering potentially causes the observed increase of pollutant concentrations at night under calm conditions in a stable nocturnal BL. Acknowledgement This work was sponsored by the Department of the Army/ U.S. Army Construction Engineering Research Laboratories (CERL) via subcontract with the University of South-Carolina (USC), Grant No. DACA42-02-2-0052, in support of the DOD Pollution Prevention Partnership. The authors gratefully acknowledge the collaboration and field support received by Jill Whiting, Jim Trostle, and Becky Champion (CSU-OLC), Jack Greenlee, Hugh Westbury, Polly Gustafson, and John Brent (Ft. Benning), Frank Burch and Steven Davis (Columbus Water Works), Allen Braswell and Stephen Willard (Ft. Gordon), Venus Dookwah, Wes Younger and Michael Chang (GIT-EAS). PB start at noon Wind shift