Download

1 / 25
250 likes | 325 Vues
Notes Graphs. A graph is just a picture of an amount of something. Like size of buildings since 1900. Types of graphs. Circle or pie graph. Shows fractions of a whole. Bar graph uses bars to show the data (words or numbers).

E N D
A graph is just a picture of an amount of something. Like size of buildings since 1900. Types of graphs
Histogram used to show pure numbers in order. Range of data can be shown, bars should be touching.
Line graph, shows points plotted on a graph connected by a line. Any type of data.
On a typical graph there are 2 axis. • an X and a Y.
Your independent variable goes on X axis ( it is almost always time) • Your dependent variable goes on Y axis
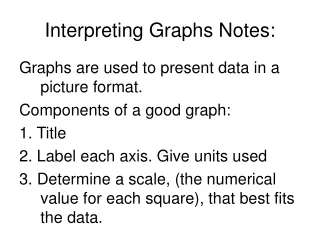
Your X and Y axis scale can be different • but the spacing between the numbers should be the same on an axis. • Graphs should have title, and descriptions on both X and Y axis.
In other words your graph should TALK • T title • A axis evenly spaced • L label both axis and title • K key or legend if needed
Two very important terms when working with graphs. • Interpolation and Extrapolation Vocabulary
Interpolation – is when you find a value that lies on the smooth curve or line between two actual data points.
Extrapolation – Find a value that lies on the smooth curve or line beyond the actual plotted points.
A graph is just a ______________ ____________ of something. Like size of buildings since 1900. Types of graphs
Bar graph uses bars to show the __________ (words or numbers).
Histogram used to show _________ __________. Range of data can be shown, bars should be touching.
_____________, shows points plotted on a graph connected by a line. Any type of data.
On a typical graph there are 2 axis. • an ______________.
Your ____________ variable goes on X axis ( it is almost always time) • Your ____________ variable goes on Y axis
Your X and Y axis scale can be different • but the spacing between the numbers should be the same on an axis. • Graphs should have __________ _____________on both X and Y axis.
In other words your graph should TALK • T _________ • A ______________________ • L ______________________ • K______________________
Two very important terms when working with graphs. • Interpolation and Extrapolation Vocabulary
Interpolation – is when you find a value that lies on the smooth curve or line between two actual data points.
Extrapolation – Find a value that lies on the smooth curve or line beyond the actual plotted points.