Download
1 / 2
20 likes | 157 Vues
Solution to exercise 2. using namespace RooFit ; void ex2() { RooWorkspace w("w", kTRUE ) ; // Make Gaussian pdf w.factory (" Gaussian ::g(x[-10,10], mean [-10,10],sigma[3,0.1,10])") ; // Make Chebychev pdf w.factory (" Chebychev :: bkg (x,{a0[0,-1,1],a1[0.1,-1,1]})") ;

E N D
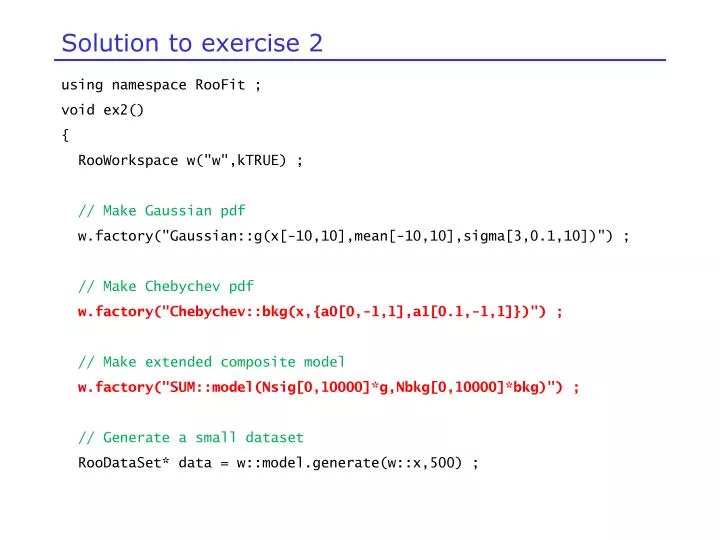
Solution to exercise 2 usingnamespace RooFit ; void ex2() { RooWorkspace w("w",kTRUE) ; // MakeGaussian pdf w.factory("Gaussian::g(x[-10,10],mean[-10,10],sigma[3,0.1,10])") ; // MakeChebychev pdf w.factory("Chebychev::bkg(x,{a0[0,-1,1],a1[0.1,-1,1]})") ; // Makeextendedcomposite model w.factory("SUM::model(Nsig[0,10000]*g,Nbkg[0,10000]*bkg)") ; // Generate a small dataset RooDataSet* data = w::model.generate(w::x,500) ;
Solution to exercise 2 // Fit model to data, save complete fit result RooFitResult* r = w::model.fitTo(*data,Save()) ; // Plot data, model, background component of model RooPlot* frame = w::x.frame() ; data->plotOn(frame) ; w::model.plotOn(frame) ; w::model.plotOn(frame,Components("bkg"),LineStyle(kDashed)) ; frame->Draw() ; // Visualizeuncertaintiesontotal pdf, background component w::model.plotOn(frame,VisualizeError(*r),MoveToBack()); w::model.plotOn(frame,VisualizeError(*r),Components("bkg"), MoveToBack(),FillColor(kYellow)) ; frame->Draw() ; }