Download
1 / 14
140 likes | 226 Vues
Earthquakes Volcanoes Tsunamis. Earth is Alive! (At Least Geologically). Far fewer mountain ranges-less snowboarding!! Far fewer large sedimentary basins A mere fraction of the hydrocarbons that we enjoy today!!!. Without Plate Tectonics. Worldwide Rate of Oil Consumption.

E N D
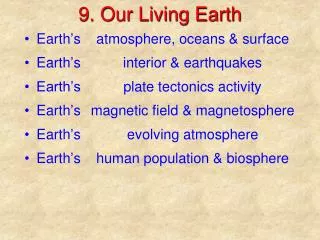
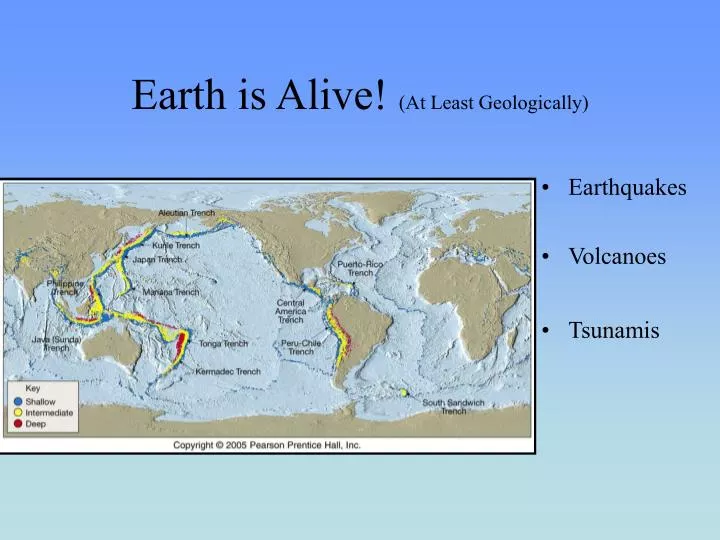
Earthquakes Volcanoes Tsunamis Earth is Alive! (At Least Geologically)
Far fewer mountain ranges-less snowboarding!! Far fewer large sedimentary basins A mere fraction of the hydrocarbons that we enjoy today!!! Without Plate Tectonics
Worldwide Rate of Oil Consumption Worldwide current consumption rate is about 85 million barrels per day At this rate there are only about 30 years left using petroleum This does not factor in growing countries like China or India
US Rate of Consumption Current consumption rate is about 20 million barrels per day +/- (remember 85 million is worldwide) We import more than 60% of our consumption
Worldwide Production and Reserves Country Estimated Reserves 2004 Production (billion barrels) 1. Saudi Arabia 267 10.4 mb/d 2. Russia 60 9.3 mb/d 3. USA 21 8.7 mb/d 4. Iran 132 4.1 mb/d 5. Mexico 13 3.8 mb/d 6. China 18 3.6 mb/d 7. Norway 8 3.2 mb/d 8. Canada 179 (inc tar sands) 3.1 mb/d 9. Venezuela 79 2.9 mb/d 10. United Arab Emirates 98 2.8 mb/d
Largest Oil Fields Field, CountrySize estimate 1. Ghawar, Saudi Arabia 75-83 billion barrels 2. Burgan, Kuwait • in decline 66-72 billion barrels 3. Bolivar Coastal, Venezuela 30-32 billion barrels 4. Safaniya-Khafji, Saudi Arabia/Neutral Zone 30 billion barrels 5. Rumailia, Iraq 20 billion barrels 6. Tengiz, Kazakhstan 15-26 billion barrels 7. Ahwaz, Iran • in decline 17 billion barrels 8. Kirkuk, Iraq 16 billion barrels 9. Marun, Iran 16 billion barrels 9a. Daqing, China • in decline 16 billion barrels 10. Gachsaran, Iran 15 billion barrels
US Largest FieldsAll in Severe Decline Field, StateCumulative Production + Est. Reserves 1. Prudhoe Bay, Alaska 13+ billion barrels 2. East Texas 5.1-6.0 billion barrels 3. Wilmington, California 2.8 billion barrels 4. Midway-Sunset, California 2.8 billion barrels 5. Kuparuk River, Alaska 2.6 billion barrels 6. Thunder Horse, Gulf of Mexico 2.0 billion barrels 7. Kern River, California 1.95 billion barrels 8. Yates, West Texas 1.95 billion barrels 9. Belridge South, California 1.9 billion barrels 10. Wasson, West Texas 1.8 billion barrels
US Rate of Consumption Current consumption rate is about 20 million barrels per day (remember 85 million is worldwide) We import more than 60% of our consumption
Nonrenewable Replacements for Petroleum Hydrocarbons • Oil Shale in Western US (1 Trillion Barrels-110 years for USA-in USA) • Tar Sands Canada (175 Billion Barrels) • Natural Gas (Large Reserves-4 years if switched)
Renewable Replacements for Petroleum Hydrocarbons • Solar • Wind • Hydroelectric • Geothermal • Biomass Ex: Ethanol (Brazil is self sufficient), Biodiesel • Fuel Cell Technology (Developing) ====================================== • Improved efficiency-hybrid cars etc. • Conservation