Download

1 / 35
350 likes | 486 Vues
USFS Region 1 SAS Analysis of Lake Chemistry, NADP, and IMPROVE data. Jill Grenon and Mark Story, Gallatin NF. R1 Air Quality Monitoring Program Overview Non Parametric Statistical Methods Statistical Test Results Tentative Conclusions. USFS R1 Wilderness Air Quality Monitoring Plan

E N D
USFS Region 1 SAS Analysis of Lake Chemistry, NADP, and IMPROVE data Jill Grenon and Mark Story, Gallatin NF • R1 Air Quality Monitoring Program Overview • Non Parametric Statistical Methods • Statistical Test Results • Tentative Conclusions
USFS R1 Wilderness Air Quality Monitoring Plan Mark Story - Gallatin NF, Thomas Dzomba - USFS R1/R4 AFA, Jill Grenon - Gallatin NF/MSU 2/1/2008 INTRODUCTION Protection of air quality values is a key component of both the Clean Air Act and Wilderness Act. The USFS Region 1 has 13 designated Wilderness areas. In terms of air quality, seven are designated as Class I Wilderness areas and six are designated as Class II Wilderness Areas. Class l areas in USFS R1 were designated by the Clean Air Act amendments of 1977. The 1977 Clean Air Act amendments assigned the Forest Service an “affirmative responsibility” to protect the Air Quality Related Values (AQRV’s) of Class l areas. Class II areas include all other areas of the country that are not Class I. Class II Wilderness areas are Class II for the Clean Air Act Prevention of Significant Deterioration (PSD) regulations. Air quality protection authority (beyond ambient air quality standards and PSD increments) for Class II Wilderness areas therefore relies primarily upon the Wilderness Act with the air quality values titled Wilderness Air Quality Values (WAQV’s). Region 1 has been actively monitoring AQRVs and WAQVs since 1989. Formal AQRV monitoring plans for regional Class I Wilderness areas were developed between 1989 and 1996. For Class II Wilderness areas, formal WAQV plans were developed in 2007 and 2008 in accordance with the 10-Year Wilderness Challenge. The following table summarizes the plan development for each Wilderness area; each plan is referenced at the end of this plan and tabulated below. http://www.fs.fed.us/r1/gallatin/resources/air/
R1 AIR QUALITYBEYOND EXCEL • Excel limited in statistical power • Used SAS to run non parametric tests to test for statistically significant trends in USFS R1 AQ Data • Analyzed R1 Lakes, NADP, and IMPROVE data.
Statistics • SAS Institute statistical software was used to run analyses following draft USFS Data Analysis Protocol (DAP) recommendations in coordination with Lori Porth, RMRS Statistician • Non-parametric test that can work with non-normal distributions and are not affected by errors, gross outliers, or missing data in the data set. • A trend is detectable and considered significant if it meets our designated alpha level of α = 0.1 also shown as 90% confidence level. Additional confidence levels used were 95 (α = 0.05), 99 (α = 0.01), and 99.9 (α = 0.001). (Salmi et.al 2002).
Statistical Tests Used • Mann-Kendall- run to see if there were significant trends for each parameter • Kruskal-Wallace- run to see if seasons in the data set were statistically different • Seasonal Mann-Kendall-run to look for trends while taking seasonality into account • Sens slope estimator- magnitude of slope
Our Hypothesis • Ho = Lake chemistry, air chemistry, and visibility show no trend through time • H1 = Lake chemistry, air chemistry, and visibility are not stable and have either an increasing or decreasing trend over time
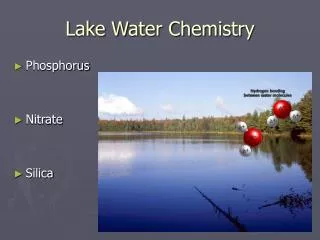
R1 AQ Lake data limitations Mann-Kendall test was used for analysis of lakes. No seasonal data available More than 10 years of data available but from an array of months
Cabinet Mountain Wilderness Lower Libby Upper Libby Selway-Bitterroot Wilderness North Kootenai Shasta Absaroka-Beartooth Wilderness Stepping Stone Twin Island
NADP sites in and around MT Glacier Clancy Lost Trail Pass Little Bighorn Tower Junction Cratersof the Moon
Glacier NADP site percent confidence level and trend direction
IMPROVE SITES GLAC1 CABI1 MONT1 GAMO1 SULA1 YELL2
Yell2 IMPROVE site on a clear day and on a hazy day Spectrum Seriesdv=0 Bext=10 SVR=390 Spectrum Seriesdv=17 Bext=52 SVR=75
Key IMPROVE Components • PM2.5 components measured: • Sulfate (SO4) • Nitrate (NO3) • Organic Carbon (OMC) • Elemental Carbon (EC) also (LAC) • Coarse Particulate Matter (ECM) • Sea Salt • Fine Soils
Conclusions • Trend interpretation, particularly cause/effect is difficult and complex • Lake ANC decrease not statistically validated except at Stepping Stone Lake. The pH increasing trend and decrease in lake cation trends are not readily explainable • Consistent NH4 increase trend at all of the NADP sites. This may be partially due to increased agriculture emissions such as feedlots in E. Oregon and E. Washington • NO3 trend increases in lakes and NADP not as consistent as NH4 increase • Consistent decrease SO4 at NADP sites is consistent with US trends the last 2 decades with reduced industrial sulfate emissions • Consistent improvement in visibility at most of the IMPROVE sites as expressed in increased SVR, decreased deciviews, and reduced extinction • 20% best and worst visibility day trends visually correlates well with wildfire emissions. • More work in interpretation needs to be done before report finalization
Danke, Gracias, THANKS • Laurie Porth – RMRS • Scott Copeland – USFS/CSU Lander • Greg Bevenger – Shoshone NF • Thomas Dzomba – USFS R1 Danke, Gracias, THANKS