Download
1 / 18
180 likes | 282 Vues
Developing Ecological Indicators for Fisheries Management using IOOS Defined Habitat Characteristics in the Mid-Atlantic Bight. Laura Palamara, John Manderson, Josh Kohut, Matthew Oliver, John Goff, Steven Gray. Objectives.

E N D
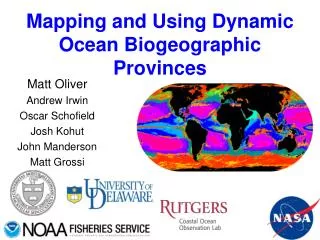
Developing Ecological Indicators for Fisheries Management using IOOS Defined Habitat Characteristics in the Mid-Atlantic Bight Laura Palamara, John Manderson, Josh Kohut, Matthew Oliver, John Goff, Steven Gray
Objectives • Model fish distributions (multi- and single-species) using environmental data: benthic AND pelagic • See if we can use remotely sensed data as a surrogate for going out to sea • Apply model results to fisheries management • Important environmental indices • EFH, MPA • Curb by-catch
NEFSC bottom trawls Spring 2003 - Fall 2007 65 Species Statistical models of fish-habitat associations
Ship Surveys: Bottom Habitat Data • depth • median • standard deviation • slope • median • standard deviation • aspect • median • standard deviation • profile curvature • median • standard deviation • tangential curvature • median • standard deviation • sediment grain size Bathymetry Sediment Grain Size
Ship Surveys: CTD • temperature • surface • bottom • salinity • surface • bottom • stratification • mixed-layer depth • Simpson’s potential energy • entire water column • top 30 meters
Integrated Ocean Observation Systems: Satellite Data • sea surface temperature • mean • standard deviation • water-leaving radiance (ocean color) • 412 nm (M & SD) • 443 nm (M & SD) • 488 nm (M & SD) • 531 nm (M & SD) • 551 nm (M & SD) • 667 nm (M & SD) • Chlorophyll a • mean • standard deviation • water mass data Sea Surface Temperature Ocean Color
Integrated Ocean Observation Systems: HF radar - ocean currents • detided & filtered along-shore velocity • detided & filtered cross-shore velocity • variance in raw along-shore velocity • variance in raw cross-shore velocity • divergence • average • trend • vorticity • average • trend Current Velocity Divergence Trend
Multivariate Analysis (CCA)Final Environmental Variables Used • Depth (log-transformed) • Profile curvature • Slope (residuals vs. depth) • Sediment grain size IOOS Benthic • SST • 488 nm reflectance • 551 nm reflectance (residuals vs. 488 nm) • Cross-shore velocity • Variance in cross-shore velocity • Divergence trend CTD • Mixed-layer depth • Simpson’s PE (limited to top 30 m) • Bottom temp • Bottom salinity (residuals vs. depth)
Community Axis 1 Temp Depth 551 nm resids
Percent of Explained Community Variation Partial CCA divergence trend 488 nm reflectance bottom T SST bottom salinity residuals SST mixed-layer depth current velocity IOOS Benthic 5.2% 47.6% 33.5% 16.8% 22.0% 41.6% 27.5% 21.4% 14.1% 6.1% 8.9% 25.6% 16.7% CTD 56.5% 30.9% 24.8% Simpson’s potential energy
Squid GAM • Used multivariate results as a guide • Explained approximately 85% of the variation in squid abundance • Variables included: • bottom temperature • SST x depth interaction • sediment grain size • current velocity • divergence trend • water-leaving radiance: 488 nm
Conclusions • Pelagic habitat is important • IOOS provides useful measures of the pelagic habitat • IOOS increases explanatory power of statistical habitat models