Download
1 / 23
230 likes | 305 Vues
New sensors and models for complex environmental conditions. John N. Porter University of Hawaii. If one cannot accurately measure the in situ optical properties of the environment, then developing a satellite remote sensing algorithm is like trying to hit a target with poor vision

E N D
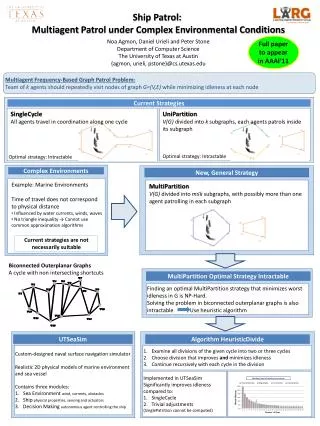
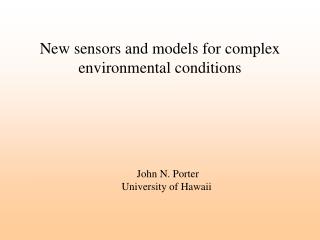
New sensors and models for complex environmental conditions John N. Porter University of Hawaii
If one cannot accurately measure the in situ optical properties • of the environment, then developing a satellite remote sensing • algorithm is like trying to hit a target with poor vision • Hard to see the target • (you will use inadequate/incorrect algorithms), • 2) Hard to see if you hit the target • (difficult to determine if your results are correct) While new satellite algorithms are moving forward, more effort is needed for environmental optical characterization.
What is still missing in our environmental optical toolbox ? • 1) Aerosol Polar Nephelometer • 2) Automatic Sun-Sky Photometer for use on ships and aircraft • 3) Monte Carlo radiative transfer programs which can deal with land, • ocean and atmosphere inhomogeneity • 4) All-sky camera network to map out spatial distribution of clouds • We are now working on these problems.
Ground-based aerosol polar nephelometer Modified to make polarization measurements Field measurements planned for summer. Sea salt phase function (unpolarized light) UAE dust/pollution phase function (vertical and depolarization)
Mini custom polar nephelometer - Tried various approaches with low cost components - System still under testing with more expensive components
Aircraft handheld sun photometer measurements Many bad values must be removed! Aircraft Height Agreement with ground Cimel Porter, J.N. A. Clarke, J. Reid, G. Shaw, H. Maring, E. Reid, D. Kress, Handheld Sun Photometer Measurements From Light Aircraft, J. Atmos. Ocean. Tech., 24, 1588-1597, 2007.
WebCam Sun-Sky Photometer (WCSSP) (for ships and aircraft)Basic design already tested, now incorporating faster components
Calibration of new automatic sun-sky photometer (at MLO, Hawaii) Beers Law I = Io exp(- τ /cos(θ) (define AirMass = 1/cos(θ) ) V = Vo exp(-τ AirMass) ln(V) = - τ AirMass + ln(Vo) determine Vo by extrapolating to zero air mass New sun-sky photometer system tracked sun automatically on several days with excellent results. The concept of using webcams for sun alignment works well. The System upgrades for faster performance are near completion.
A new Monte Carlo radiative transfer model (AO3D). To study light fields in complex cases with inhomogeneous conditions Example of complex coastal site (UAE 2, MAARCO site)
AO3D tracks photons through the atmosphere-ocean and uses Monte Carlo techniques to solve radiation problems. AO3D accounts for: ocean surface roughness and whitecaps multiple aerosol layers refraction (index of refraction layer changes) earth curvature user specified optical properties AO3D compares well with Modtran4 COART Kattawar and Adams Bates, D. and J. Porter, AO3D: A Monte Carlo Code for Modeling of Environmental Light Propagation, accepted in Journal of Quantitative Spectroscopy and Radiative Transfer, January 2008.
AO3D example of photons entering the ocean surface (laser beam) (double click to start movie)
AO3D model of laser beam entering ocean. Points show where photon was absorbed
Monte Carlo time-resolved calculations. AO3D compared with lidar equation. Standard Lidar Eq. (green) Monte Carlo simulation (blue)
AO3D top of the atmosphere radiance compared with Kattawar and Adams (1978) Kattawar and Adams (circles) AO3D (triangles) Calculations of total-scatter TOA radiance for spherical-shell molecular atmosphere with no surface reflection.
Calculation of height of aerosol layer over Mauna Loa Observatory Sun photometer measurements made at Mauna Loa Observatory using new automated sun tracking sun photometer out to air mass 20 (small dots). Larger dots show expected values calculated with AO3D Monte Carlo radiation model for aerosol layer placed at different heights. Best agreement is found when aerosol layer is placed slightly above the observatory. Only coarse aerosol positioning was attempted. Further studies could provide a better fit. Bates and Porter, 2007
AO3D Monte Carlo code showing that an inhomogeneous surface has a significant impact on sky radiance. Land | Ocean Tropical Atmosphere Sulfate Aerosols SZA = 60deg Figure above shows sky radiance for a coastal site with part of the sky over land and the other over ocean. Three different aerosol optical depths are shown. Surface inhomogeneity turns out to significantly affect the sky radiance for all aerosol loadings ! (unpublished results) Example of Azimuth Angle Scan
Cloud Mapping Stereo Camera System Cloud cover, cloud shape, cloud microphysical properties, and location all affect surface and satellite radiation measurements. In order to model these light fields it is therefore important to quantify cloud properties as much as possible. In addition to radiation problems, there is also a need for new wind measurements aloft where little data exists. Cloud tracking can be used to derive winds aloft. For these reasons we have begun testing a new approach to map out cloud fields and to derive wind fields at different heights using ground based stereo cameras.
Example of clouds passing over Honolulu. (double click image)
Calculation of relative wind speed based on feature tracking with spatial correlation. Wind vectors calculated from two images and overlain on one of the images.
Cloud simulation model to test how far apart the stereo cameras need to be and what the accuracy is needed for camera azimuth and zenith angles. (work in progress)
In order to derive cloud position accurately from stereo cameras, we need to know the camera internal and external calibrations (azimuth and zenith angles for each pixel). Internal calibration was carried out with a reference pattern and an example is shown on the right. External calibration is achieved by external reference points. To be discussed in detail in the future publication.
In order to test the camera internal calibration we carried out a set of independent measurements using a pan-tilt system. A single bright light source was placed ~80 m away and the camera was panned and tilted under computer control. Preliminary results are shown below. The error seen in the azimuth angle figure is likely due to cases with near zero zenith angle (azimuth angle poorly defined). (work in progress) Camera on pan-tilt System. Two different camera angular calibration approaches plotted versus each other.
Conclusion • Good progress is occurring in each of these 4 areas and new papers will • be appearing soon. • Aerosol Polar Nephelometer • 2) Automatic Sun-Sky Photometer for use on ships and aircraft • 3) Monte Carlo radiative transfer programs which can deal with land, • ocean and atmosphere inhomogeneity • All-sky camera network to map out spatial distribution of clouds • and wind speeds.