Download
1 / 20
210 likes | 333 Vues
Optimization of Sensor Response Functions for Colorimetry of Reflective and Emissive Objects. Mark Wolski*, Charles A. Bouman, Jan P. Allebach Purdue University, School of Electrical and Computer Engineering, West Lafayette, IN 47907 Eric Walowit

E N D
Optimization ofSensor Response Functionsfor Colorimetry ofReflective and Emissive Objects Mark Wolski*, Charles A. Bouman, Jan P. Allebach Purdue University, School of Electrical and Computer Engineering, West Lafayette, IN 47907 Eric Walowit Color Savvy Systems Inc., Springboro, OH 45066 *now with General Motors Research and Development Center, Warren, MI 48090-9055.
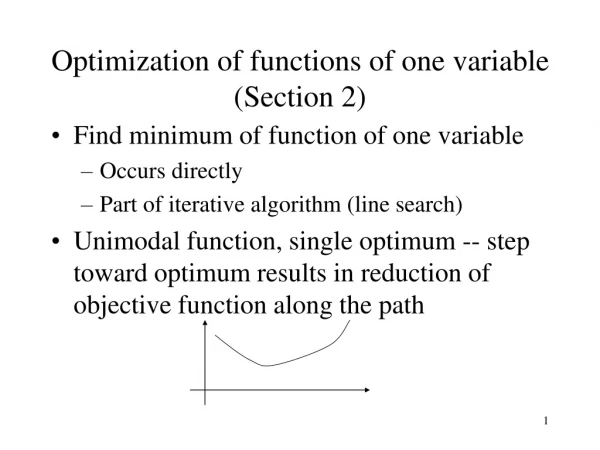
Overall Goal Design components (color filters) for an inexpensive device to perform colorimetric measurements from surfaces of different types
Device Operation Highlights • Output: XYZ tristimulus values • 3 modes of operation Emissive Reflective/EE Reflective/D65 EE D65 n n n
n 700 400 l Computation of Tristimulus Values • Stimulus Vector – n • Emissive Mode • Reflective Mode 31 samples taken at 10 nm intervals
Tristimulus Vector • Tristimulus vector • Color matching matrix – Am (3x31) • Effective stimulus
z x y l Color Matching Matrix 3x31 matrix of color matching functions
Device Architecture Detectors LED’s LED’s Filters
Estimate of Tristimulus Vector • Estimate • Channel matrix • emissive mode • reflective modes
Error Metric • Tristimulus error • CIE uniform color space
Error Metric (cont.) • Linearize about nominal tristimulus value t = t0 • Linearized error norm
Error Metric (cont.) • Consider ensemble of 752 real stimuli nk • Rearrange and sum over k
Regularization • Filter feasbility • Roughness cost • Design robustness • Effect of noise and/or component variations • Augment error metric
Design Problem • Overall cost function • Solution procedure • For any fixed F =[f1, f2, f3, f4]T determine optimal coefficient matrices TEM, TEE, and TD65 as solution to least-squares problem • Minimize partially optimized cost via gradient search
Experimental Results • Optimal filter set for Kr = 0.1 and Ks = 1.0
Experimental Results (cont.) • Effect of system tolerance W on mean-squared error
Experimental Results (cont.) • Error performance in true L*a*b* for set of 752 spectral samples
Experimental Results (cont.) • Emissive mode L*a*b* error surface
Conclusions • For given device architecture, it is possible to design components that will yield satisfactory performance • filters are quite smooth • device is robust to noise • excellent overall accuracy • Solution method is quite flexible • independent of size of sample ensemble • Vector space methods provide a powerful tool for solving problems in color imaging