Download

1 / 17
170 likes | 324 Vues
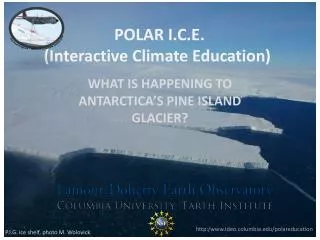
ICE Pod Program – LDEO of Columbia University . POLAR I.C.E. (Interactive Climate Education). WHAT IS HAPPENING TO ANTARCTICA’S PINE ISLAND GLACIER?. http:/ www.ldeo.columbia.edu / polareducation. P.I.G. ice shelf, photo M. Wolovick. ABOUT GLACIERS ….

E N D
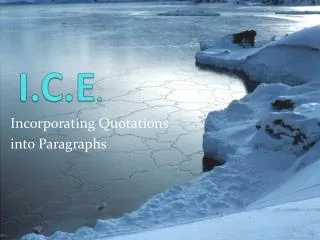
ICE Pod Program – LDEO of Columbia University POLAR I.C.E. (Interactive Climate Education) WHAT IS HAPPENING TO ANTARCTICA’S PINE ISLAND GLACIER? http:/www.ldeo.columbia.edu/polareducation P.I.G. ice shelf, photo M. Wolovick
ABOUT GLACIERS… Glaciers are large expanses of ice. In the polar regions they are continental sized! Greenland’s Kangerdlugssuaq Glacier, photo by P. Spector • Glaciers form where snow remains year-round, compressing into ice over time. • Glacier Accounting is like a bank account: • They remain balanced (equal in size) if the snow added annually equals the snow lost; • They grow when more is added (snow) than removed (melt); • They shrink when more is removed (melts) than added (snow).
Tugged by gravity they move under their own weight, flowing from areas of higher elevation to areas of lower elevation. Glaciers are in constant motion. Greenland’s Kangerdlugssuaq Glacier, photo by P. Spector
Calving – One way in which glaciers lose mass Steep edge where sections of ice break off at the front of a glacier, collapsing into icy rubble. Glaciers in the polar regions can lose ‘mass’ in several ways – calving (chunks of ice breaking off ), melting, wind blow, and sublimating straight to water vapor. This loss of ice mass is called ‘ablation’. Greenland’s Jakobshavn Glacier, photo by I. Das
The Glacial System Start with ‘New snow falls’ and move counter clockwise to follow the system . ‘Accumulation’ ‘Ablation’ edited from R. Bell, The Unquiet Ice, Scientific American, Feb. ‘08)
About Measuring Glaciers… • Satellites have been collecting information about the Earth since the 1990’s. • NASA ICESat I used a laser to measure ice surface elevation from 2003 to 2009. These measurements are accurate to ~15 cm (6 inches) of elevation! • Today’s activity uses ICESat data to measure changes to ice elevation of Pine Island Glacier.
About Pine Island Glacier (P.I.G.)… This activity focuses on ice surface elevation on P.I.G. The red line shows where the ICESat ice surface data used in this activity was collected. Glacier flow direction
Where in Antarctica is Pine Island Glacier? Edited Antarctic land surface map (without ice) from British Antarctic Survey BEDMAP program, 2011.
About Antarctica’s Ice Shelves… East Antarctica West Antarctica • Ice Shelves surround the Antarctic Ice Sheet. • Like barricades they block the glaciers, slowing the ice flow off the landmass. • The larger the ice shelf, the larger the barricade. • Pine Island Glacier has a very small ice shelf – too small to show in this graphic. Edited from T. Scambos, National Snow and Ice Data Center
Is P.I.G. a ‘climate canary’*? Let’s do the activity! Working with Ice Elevation Data from P.I.G. you can answer this important question! *Years ago miners used canaries as an early warning signal to alert them to toxic changes in the air inside the mines. Canaries have become a symbol of an early alert to approaching danger. Our canary wears shades as protection from the reflectivity of the glacial snow (known as albedo). Ice albedo is a key ingredient in the ongoing cooling of our Earth system.
Graph of 3 sets of P.I.G. elevation data Meters of elevation Distance in kilometers
GRAPHING P.I.G. DATA FOR LINE #279 For each dataset in 2007 you will calculate the change (delta ) from 2003, completing the last two columns in this chart. Then graph the in Part II, using 2003 as your zero line and the for April and October 2007.
Graph of delta-comparison to 2003 Delta in elevation ( Meters) Distance in kilometers
ICE Pod Program – LDEO of Columbia University Project website: http://www.ldeo.columbia.edu/icepod/ Education website: http://www.ldeo.columbia.edu/polareducation/