Download
1 / 4
40 likes | 189 Vues
Detecting Changes in Intracranial Pressure Non-Invasively Using Oto-Acoustic Emissions. Kevin N. Sheth 1 , Nicholas Horton 2 , Christopher Shera 3 , Jonathan Rosand 1 , Susan Voss 4.

E N D
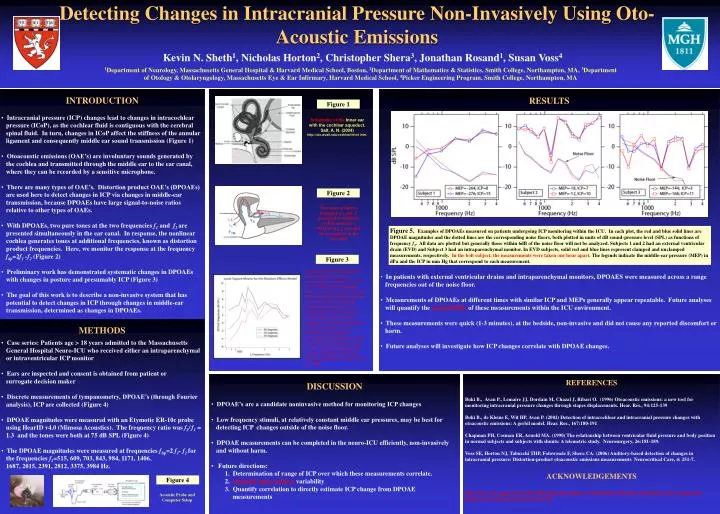
Detecting Changes in Intracranial Pressure Non-Invasively Using Oto-Acoustic Emissions Kevin N. Sheth1, Nicholas Horton2, Christopher Shera3, Jonathan Rosand1, Susan Voss4 1Department of Neurology, Massachusetts General Hospital & Harvard Medical School, Boston, 2Department of Mathematics & Statistics, Smith College, Northampton, MA, 3Department of Otology & Otolaryngology, Massachusetts Eye & Ear Infirmary, Harvard Medical School, 4Picker Engineering Program, Smith College, Northampton, MA • INTRODUCTION • Intracranial pressure (ICP) changes lead to changes in intracochlear • pressure (ICoP), as the cochlear fluid is contiguous with the cerebral • spinal fluid. In turn, changes in ICoP affect the stiffness of the annular • ligament and consequently middle ear sound transmission (Figure 1) • Otoacoustic emissions (OAE’s) are involuntary sounds generated by • the cochlea and transmitted through the middle ear to the ear canal, • where they can be recorded by a sensitive microphone. • There are many types of OAE’s. Distortion product OAE’s (DPOAEs) • are used here to detect changes in ICP via changes in middle-ear • transmission, because DPOAEs have large signal-to-noise ratios • relative to other types of OAEs. • With DPOAEs, two pure tones at the two frequencies f1and f2 are • presented simultaneously in the ear canal. In response, the nonlinear • cochlea generates tones at additional frequencies, known as distortion • product frequencies. Here, we monitor the response at the frequency • fdp=2f1 -f2 (Figure 2) • Preliminary work has demonstrated systematic changes in DPOAEs • with changes in posture and presumably ICP (Figure 3) • The goal of this work is to describe a non-invasive system that has • potential to detect changes in ICP through changes in middle-ear • transmission, determined as changes in DPOAEs. • RESULTS • In patients with external ventricular drains and intraparenchymal monitors, DPOAES were measured across a range • frequencies out of the noise floor. • Measurements of DPOAEs at different times with similar ICP and MEPs generally appear repeatable. Future analyses • will quantify the repeatability of these measurements within the ICU environment. • These measurements were quick (1-3 minutes), at the bedside, non-invasive and did not cause any reported discomfort or • harm. • Future analyses will investigate how ICP changes correlate with DPOAE changes. Figure 1 Schematic of the Inner ear with the cochlear aqueduct. Salt, A. N. (2004) http://oto.wustl.edu/cochlea/intro1.htm. Figure 2 Two tones at the two frequencies f1and f2 presented to nonlinear cochlea generate a DPOAE at fdp, recorded by microphone in the ear canal. Figure 5. Examples of DPOAEs measured on patients undergoing ICP monitoring within the ICU. In each plot, the red and blue solid lines are DPOAE magnitudes and the dotted lines are the corresponding noise floors, both plotted in units of dB sound-pressure level (SPL) as functions of frequency f2. All data are plotted but generally those within 6dB of the noise floor will not be analyzed. Subjects 1 and 2 had an external ventricular drain (EVD) and Subject 3 had an intraparenchymal monitor. In EVD subjects, solid red and blue lines represent clamped and unclamped measurements, respectively. In the bolt subject, the measurements were taken one hour apart. The legends indicate the middle-ear pressure (MEP) in dPa and the ICP in mm Hg that correspond to each measurement. Figure 3 Summary of DPOAE magnitude measurements across five measurement sessions for each of seven healthy normal-hearing subjects, in three postural positions. The figure shows the least-squares mean values for the DPOAE magnitudes predicted with a random effects statistical model, controlling for day, position, frequency, the interaction between position and frequency, and clustering within subjects. Corresponding standard errors for each value are all between 2 and 2.1 dB. The results suggest that changes in ICP are reflected in changes in DPOAEs (from Voss et al., 2006). • METHODS • Case series: Patients age > 18 years admitted to the Massachusetts • General Hospital Neuro-ICU who received either an intraparenchymal • or intraventricular ICP monitor • Ears are inspected and consent is obtained from patient or • surrogate decision maker • Discrete measurements of tympanometry, DPOAE’s (through Fourier • analysis), ICP are collected (Figure 4) • DPOAE magnitudes were measured with an Etymotic ER-10c probe • using HearID v4.0 (Mimosa Acoustics). The frequency ratio was f2/f1 = • 1.3 and the tones were both at 75 dB SPL (Figure 4) • The DPOAE magnitudes were measured at frequencies fdp=2 f1- f2 for • the frequencies f2=515, 609, 703, 843, 984, 1171, 1406, • 1687, 2015, 2391, 2812, 3375, 3984 Hz. • DISCUSSION • DPOAE’s are a candidate noninvasive method for monitoring ICP changes • Low frequency stimuli, at relatively constant middle ear pressures, may be best for • detecting ICP changes outside of the noise floor. • DPOAE measurements can be completed in the neuro-ICU efficiently, non-invasively • and without harm. • Future directions: • 1. Determination of range of ICP over which these measurements correlate. • 2. Quantify intra-subject variability • 3. Quantify correlation to directly estimate ICP change from DPOAE measurements REFERENCES Buki B., Avan P., Lemaire JJ, Dordain M, Chazal J, Ribari O. (1996) Otoacoustic emissions: a new tool for monitoring intracranial pressure changes through stapes displacements. Hear. Res., 94:125-139 Buki B., de Kleine E, Wit HP, Avan P. (2002) Detection of intracochlear and intracranial pressure changes with otoacoustic emissions: A gerbil model. Hear. Res., 167:180-191 Chapman PH, Cosman ER, Arnold MA. (1990) The relationship between ventricular fluid pressure and body position in normal subjects and subjects with shunts: A telemetric study. Neurosurgery, 26:181-189. Voss SE, Horton NJ, Tabucchi THP, Folowosele F, Shera CA. (2006) Auditory-based detection of changes in intracranial pressure: Distortion-product otoacoustic emissions measurements Neurocritical Care, 4: 251-7. ACKNOWLEDGEMENTS This work was supported by the NIH National Institute of Neurological Disorders and Stroke and an American Medical Association Seed Grant for KNS. Figure 4 Acoustic Probe and Computer Setup