Download
1 / 26
270 likes | 657 Vues
AFMoC Enhances Predictivity of 3D QSAR: A Case Study with DOXP-reductoisomerase K. Silber, P. Heidler, T. Kurz, G. Klebe J. Med. Chem. 48(2005) 3547-3563 Journal Club, Presented by Lei Xie Motivations No other papers read Interested in interface of biology and chemistry

E N D
AFMoC Enhances Predictivity of 3D QSAR: A Case Study with DOXP-reductoisomerase K. Silber, P. Heidler, T. Kurz, G. Klebe J. Med. Chem. 48(2005) 3547-3563 Journal Club, Presented by Lei Xie
Motivations • No other papers read • Interested in interface of biology and chemistry • Inspired by a talk on nuclear receptors in the group meeting
Motivations • No other papers read • Interested in interface of biology and chemistry • Inspired by a talk in the group meeting
Outlines • Basic of 3D-QSAR • Discussion of the paper • Ideas derived from the paper
Concept of 3D QSAR • Correlates spatially located features across a chemical series with biological activity • Procedures: 1. Selection of active conformation 2. Alignment of conformers 3. 3D field calculation in a box and grids 4. Derivation and validation of models
Step 1: Selection of Active Conformation O • Global minimum-enery conformation • Active analogs and pharmacophores • Protein-ligand complex • Intuitions N
Step2: Alignment of conformers • Manuel: pharmacophore or moments of inertia • Semi-automatic: overlap of steric and electrostatic • Fully-automatic: fragment re-construction • No alignment O N
Step 3: 3D field calculation in grids • CoMFA: Lennard-Jones and Coulomb interactions • CoMSIA: molecular similarity O N
Step 4: Derivation and validation of models M1 M2 M3 ………. …… Mn • Regression, classification or clustering in a mxn matrix • Challenges in experimental design, feature selections and model validations W1 E1 W2 E2 . . . Wm Em Y
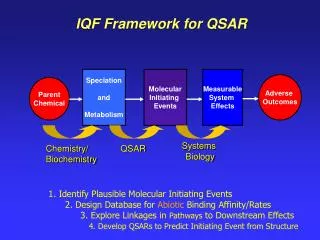
Adaptation of fields for Molecular Comparison (AFMoC)A technique to combine protein-ligand interaction and 3D-QSAR to improve selection of active conformation, alignment quality,affinity prediction
Concept of AFMoC: Step 1 • Active conformations and molecular alignments are determined with protein-ligand docking O N
Concept of AFMoC: Step 2 • Decompose the general scoring function at each of grids in the binding pocket • Interaction fields are yielded by considering the contribution of the binding ligand to each of the grids O N
Concept of AFMoC: Step 3 M1 M2 M3 ………. …… Mn • Regression with experimental affinity data to obtain binding models for specified protein family • Balance between the general and specific scoring function depending on the training data W1 E1 W2 E2 . . . Wm Em Y
DOXP-reductoisomerase(DXR):A new drug target for multidrug-resistance malaria
DXR structures • Challenges in structure-based drug design • Contains metal-ligand coordination • Requires cofactor binding - Possesses a large flexible loop
Training and Testing Data • 27 for model building • 14 for testing • Testing data set includes functional groups that are not included in the training data
Results: Regression Models • CoMFA, CoMSIA, and AFMoC all derived statistically-significant models Figure 5 (a) Experimentally determined binding affinities versus fitted predictions using the derived 3D QSAR models for the training set. Results are shown applying the optimal number of components, which is 5 for CoMFA ( ) and 4 for CoMSIA ( ), respectively. (b) Experimentally determined binding affinities versus fitted AFMoC predictions for the 27 training set DOXP-reductoisomerase inhibitors. Both experimental and calculated values are shown considering only the part of binding affinity (pIC50PLS) used in PLS analysis ( ) or considering the total binding affinity ( ). In addition to the line of ideal correlation, dashed lines are depicted to indicate deviations of one logarithmic unit from ideal prediction.
Results: Prediction Power • CoMFA and CoMSIA fail for ligands comprising functional groups not present in or exhibiting minor structural differences from the training • AFMoC is capable to correlate structural changes with affinity • General docking methods do not perform as well as AFMoC a Values are given considering only the pair potentials for the prediction or considering also the solvent-accessible surface term (values in parentheses).b Squared correlation coefficient.c In logarithmic units.d Values are given for the optimal number of components, which are 4 for AFMoC, 5 for CoMFA, and 4 for CoMSIA.e Values in italics denote lacking correlation.
Results: General vs. Adapted • Best mixture of general and adapted model depends on the available training data. Figure 8 Dependence of squared correlation coefficient (r2) for AFMoC models on the mixing coefficient between original DrugScore potentials ( = 0) and specifically adapted AFMoC fields (PLS-model, = 1).
Summary on the Paper • Protein structure information, even not perfect, is valuable for 3D-QSAR studies • Protein family adapted scoring functions is superior to general one • A general framework can be extend to other studies
Scopes • Prediction of protein-ligand binding specificity given a protein sequence and a ligand
Procedures • Decomposition of scoring functions with amino acid residues and identification of “hot spot” with known protein structures for a protein family • Derivation of regression or classification models that correlate binding ligands and evolutionary profiles at the hot spot • Exploration of genome sequences based on sequence/structure alignments and phylogenetic analysis • Extension with functional site characterization and analysis
Applications • Drug Discovery Target verifications, Lead discovery, Drug resistance (HIV, Gleevac), Off-target identifications • Protein design • Nature product identification
Data • Protein structure (not necessary complex) • Binding affinity Availability • PDBBind - Structure abundant families (protein kinase, matrix metalloproteases etc.) • Structural genomics – structure • NIH chemical genomics initiative – binding affinity • High throughput screening and combinatorial library • Protein chips and other techonologies