Download
1 / 15
150 likes | 508 Vues
CLEAN AIR ACT Presentation to the National Energy, Environment and Transportation Summit May 15, 2002 Jeff Clark U.S. EPA. CLEAN AIR ACT. 1970 Air Quality Standards, Nonattainment Areas, Air Toxics, Mobile Source Rules 1977 New Source Review, Visibility

E N D
CLEAN AIR ACT Presentation to the National Energy, Environment and Transportation Summit May 15, 2002 Jeff Clark U.S. EPA
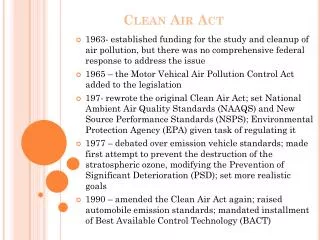
CLEAN AIR ACT 1970 Air Quality Standards, Nonattainment Areas, Air Toxics, Mobile Source Rules 1977 New Source Review, Visibility 1990 Acid Rain, Operating Permits, Stratospheric Ozone Protection, revamped Air Toxics, upgraded Mobile Source Standards, upgraded Enforcement, Regional Planning Congress: Increasingly Prescriptive Overtime
CLEAN AIR ACT • Nonattainment • New Source Review • New Source Performance Standards • Regional Haze • Emission Standards for Motor Vehicles, etc. • Emission Standards for Industrial Sources of Air Toxics • Emission Standards/Cap & Trade Program for Acid Rain • Operating Permits • Stratospheric Ozone Protection • Enforcement/Compliance
Nonattainment EPA Role - Set air quality standards - Issue emission standards for industry, vehicles, etc. - Address interstate transport - Ensure State Plans are effective State/Local Role - Develop plans (with local strategies) to meet Air Quality Standards - Implement plans - Ensure compliance
Nonattainment • EPA set Air Quality Standards for Ozone, Particulate Matter, Lead, Nitrogen Dioxide, Sulfur Dioxide and Carbon Monoxide • In 1997, EPA added 8-Hour Ozone Standards and PM2.5 Standards - More Protective
Nonattainment Specific Requirements for “Mobile” Sources • Emission Standards for Cars, Trucks, Buses • Reformulated Gasoline/Oxygenated Fuels • Standards for Non-road Engines (lawnmowers, locomotives, agriculture equipment, etc.) • Vehicle Inspection & Maintenance Programs • Enhanced Transportation Conformity
Air Toxics Phase 1- Emission Standards by 11/2000 Phase 2 - Residual Risk Standards - Emission Standards and Targeted Urban Strategies - Cleaner Fuels, Emission Standards for Vehicles • Major Industrial Sources • (chemical plants, refineries, • manufacturing, etc.) • “Area” Sources • (dry cleaners, gas stations, • etc.) • “Mobile” Sources • (cars, trucks, buses)
Acid Rain • Targeted at Electric Generating Units • Market-based Cap & Trade Program for SO2 • SO2 Emission Reductions Phased in 1995, 2000 • NOx Controls by 2000
Operating Permits • All major sources of air pollution required to have an Operating Permit • States run programs, based on requirements in EPA Rule • Does not require additional emission controls; merely pulls together existing requirements into a singledocument
Key Upcoming Events • Clear Skies Initiative • EPA Moving Ahead with 1997 Ozone and Particulate Matter Standards and Regional Haze • Legislative Action on Oxygenates/MTBE • Toxics Programs Targeted at Urban Areas
An Alternative Future for PowerThe Clear Skies Initiative • Proposed by the President February 14th • A multi-pollutant market-based approach to regulating Power Generation under the Clean Air Act
The Clear Skies Initiative Will Result in Aggressive Environmental Requirements for the Electric Power Sector 2004: The NOx SIP call (summertime NOx cap in 20 Eastern States) 2004 2008: Clear Skies NOx Phase I (2.1 million ton annual cap is assigned to two Zones, with trading programs) 2010: Clear Skies Hg Phase I (26 ton annual cap with national trading program) 2008 2010: SO2 Phase I (4.5 million ton annual cap with national trading program) 2012 2018: Clear Skies Hg Phase II (15 ton annual cap with national trading program) 2016 2018: Clear Skies NOx Phase II (1.7 million ton annual cap is assigned to two Zones with trading programs) 2018: Clear Skies SO2 Phase II (3.0 million ton annual cap with national trading program) 2020
Current* 8-hour Ozone and PM2.5 Nonattainment Ozone only [ 234 Counties ] *1997-1999 Ozone 1999/2000 PM2.5 - preliminary depiction based on two years of data. Three years of complete data are required for attainment demonstrations. PM2.5 only [ 74 Counties] Both nonattainment [ 99 Counties ]
2010 Clear Skies Initiative * Estimated Ozone and PM2.5 Nonattainment Ozone only [ 45 Counties ] *This includes projected emission reductions from utilities under the President’s Clear Skies Initiative together with projected growth and reductions in the base case. The base case includes projected growth and emissions reductions expected from Title IV, the NOx SIP Call, Tier II, and the Heavy Duty Diesel Rules. It does not include additional state actions taken to achieve NAAQS or BART. PM2.5 only [ 49 Counties ] Both Nonattainment [ 18 Counties ] Disclaimer: These maps are based on preliminary analyses conducted so that EPA could provide estimates of PM and ozone nonattainment under the Clear Skies Initiative for the 4/23/02 meeting of the Environmental Council of the States. These preliminary maps will be refined with more sophisticated atmospheric modeling which may alter the attainment status of specific counties. These maps are likely to understate the extent of future nonattainment for PM. The maps should be used in a relative sense to compare nonattainment trends under different control strategies.
2020 Clear Skies Initiative Estimated Ozone and PM2.5 Nonattainment Ozone only [ 23 Counties ] PM2.5 only [ 29 Counties ] * This includes projected emission reductions from utilities under the President’s Clear Skies Initiative together with projected growth and reductions in the base case. The base case includes projected growth and emissions reductions expected from Title IV, the NOx SIP Call, Tier II, and the Heavy Duty Diesel Rules. It does not include additional state actions taken to achieve NAAQS or BART. Both Nonattainment [ 10 Counties ] Disclaimer: These maps are based on preliminary analyses conducted so that EPA could provide estimates of PM and ozone nonattainment under the Clear Skies Initiative for the 4/23/02 meeting of the Environmental Council of the States. These preliminary maps will be refined with more sophisticated atmospheric modeling which may alter the attainment status of specific counties. These maps are likely to understate the extent of future nonattainment for PM. The maps should be used in a relative sense to compare nonattainment trends under different control strategies.