Download
1 / 66
660 likes | 1.07k Vues
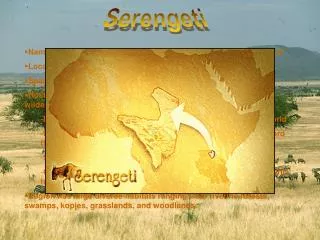
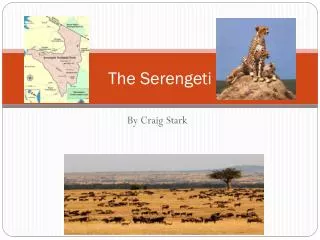
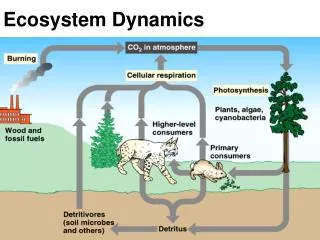
Long term dynamics of the Serengeti Ecosystem. SERENGETI ECOSYSTEM. KENYA. TANZANIA. Wildebeest migration patterns. The reason for dry season migration. Kris Metzger. Migration patterns of Zebra and Gazelle. The Serengeti-Mara Ecosystem. 24,000 square kilometers

E N D
SERENGETI ECOSYSTEM KENYA TANZANIA
The reason for dry season migration Kris Metzger
The Serengeti-Mara Ecosystem • 24,000 square kilometers • Plains – woodland migration system • 28 species of ungulates • 10 species large carnivore, hyena most numerous
Serengeti Wildebeest Population 1800 1500 1200 Population Size (x 1000) 900 600 300 0 1950 1960 1970 1980 1990 2000
The regulation of the wildebeest population • What caused the increase? • What caused the leveling out?
Serengeti Wildebeest Population 1800 Drought 1500 Rinderpest removed 1200 Population Size (x 1000) 900 600 300 0 1950 1960 1970 1980 1990 2000
Serengeti Wildebeest per capita Dry Season Food 350 300 250 200 150 100 50 0 1960 1970 1980 1990 2000
Serengeti wildebeest regulation Food limitation allows regulation of the population so that it levels out at about 1.3 million animals
Serengeti wildebeest competitors • Food limitation leads to competition with some • other grazing ungulates • Thomson’s gazelle • But not Zebra – unknown why
Predation What is the role of predators in the ecosystem?
PREDATION AS A LIMITING FACTOR IN NON-MIGRATORY SERENGETI UNGULATES Tested by predator removal experiment: In northern Serengeti for 1980-87 most large predators removed. Then they returned after 1987. Prey populations were compared to an adjacent non-removal area, Mara Park, Kenya
PREDATOR REMOVAL Thomson’s gazelle 20 kg Impala 50 kg Oribi 18kg
Conclusions on regulation • Large ungulate species food regulated • Migrant species food regulated • Small resident ungulate species predator regulated
Climate change • increase in wet season rain will increase • fuel loads and burning • increase in dry season rain will increase • fuel moisture and decrease burning • So how does burning affect the system?
Consequences of extensive burning - The decline of savanna trees
Increase in wildebeest causes decrease in burning
Complex interactions of wildebeest and the environment The extent of grass fires is determined by the degree of grazing imposed by wildebeest
Savanna 1986 1980 1991 2003
Complex interactions –changes in tree populations Savanna trees have gone through a cycle of increase and decrease followed by increase again lasting about 100 years